
Indicator Gauge Icon Legend
Legend Colors
Red is bad, green is good, blue is not statistically different/neutral.
Compared to Distribution
 the value is in the best half of communities.
 the value is in the 2nd worst quarter of communities.
 the value is in the worst quarter of communities.
Compared to Target
 meets target;
  does not meet target.
Compared to a Single Value
 lower than the comparison value;
 higher than the comparison value;
 not statistically different from comparison value.
Trend

 non-significant change over time;
 significant change over time;
  no change over time.
Compared to Prior Value
 higher than the previous measurement period;
 lower than the previous measurement period;
 no statistically different change from previous measurement period.
 Significantly better than the overall value
 Significantly worse than the overall value
 No significant difference with the overall value
 No data on significance available
Age-Adjusted Rate of Adults who are Overweight or Obese
County: Greene
Measurement Period: 2018
This indicator is archived and is no longer being updated. Click to learn more
This indicator shows the percentage of adults who are overweight or obese according to the Body Mass Index (BMI). The BMI is calculated by taking a person's weight and dividing it by their height squared in metric units (BMI = Weight (Kg)/[Height (m) ^ 2]). A BMI between 25 and 29.9 is considered overweight and a BMI >=30 is considered obese.
Why is this important?
The percentage of overweight and obese adults is an indicator of the overall health and lifestyle of a community. Being overweight or obese affects quality of life and puts individuals at risk for developing many diseases, especially heart disease, stroke, diabetes, and cancer. Losing weight helps to prevent and control these diseases. Being overweight or obese also carries significant economic costs due to increased healthcare spending and lost earnings.
Clear this location
County: Greene
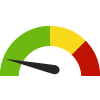
69.6%
Source:
New York Expanded Behavioral Risk Factor Surveillance System
Measurement period: 2018
Maintained by: Conduent Healthy Communities Institute
Last update: July 2022
Measurement period: 2018
Maintained by: Conduent Healthy Communities Institute
Last update: July 2022
Compared to

Technical note: The value is age-adjusted to the 2000 U.S. Standard Population.
Graph Selections

| County | Source | Measurement Period | Percent | |
|---|---|---|---|---|
There are 6 County values. The lowest value is 57%, and the highest value is 70.5%.
Half of the values are between 61.5% and 69.6%.
The middle (median) value is 66.6%.
Data Source
- New York Expanded Behavioral Risk Factor Surveillance System
Maintained By: Conduent Healthy Communities Institute (Methodology)
Filed under: Health / Weight Status, Health / Physical Activity, Health Status, Adults