
Search for Indicators
All Data
Indicator Gauge Icon Legend
Legend Colors
Red is bad, green is good, blue is not statistically different/neutral.
Compared to Distribution
 the value is in the best half of communities.
 the value is in the 2nd worst quarter of communities.
 the value is in the worst quarter of communities.
Compared to Target
 meets target;
  does not meet target.
Compared to a Single Value
 lower than the comparison value;
 higher than the comparison value;
 not statistically different from comparison value.
Trend

 non-significant change over time;
 significant change over time;
  no change over time.
Compared to Prior Value
 higher than the previous measurement period;
 lower than the previous measurement period;
 no statistically different change from previous measurement period.
County: Albany
Health
Value
Compared to:
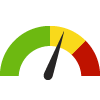
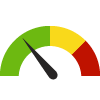
78.8%
Percentage
(2016)
Compared to:


NY Counties Exclusive of NYC
The distribution is based on data from 56 New York counties and does not include counties in New York City.
Capital Region Value
(83.3%)
The regional value is compared to the Capital Region value. The comparison value is provided by the Healthy Capital District Initiative.
Prior Value
(80.4%)
Prior Value compares a measured value with the previously measured value. Confidence intervals were not taken into account in determining the direction of the comparison.
Prevention Agenda 2013-2018
(91.3%)
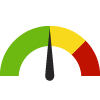
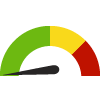
122.2
Rate per 10,000 population
(2016)
Compared to:


NY Counties Exclusive of NYC
The distribution is based on data from 57 New York counties and does not include counties in New York City.
Capital Region Value
(117.0)
The regional value is compared to the Capital Region value. The comparison value is provided by the Healthy Capital District Initiative.
Prior Value
(97.0)
Prior Value compares a measured value with the previously measured value. Confidence intervals were not taken into account in determining the direction of the comparison.
Prevention Agenda 2013-2018
(122.0)
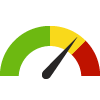
County: Albany Asthma emergency department visit rate per 10,000 population
County: Albany Asthma emergency department visit rate per 10,000 population
55.0
Rate per 10,000 population
(2016)
Compared to:
NY Counties Exclusive of NYC
The distribution is based on data from 57 New York counties and does not include counties in New York City.
Capital Region Value
(41.4)
The regional value is compared to the Capital Region value. The comparison value is provided by the Healthy Capital District Initiative.
Prior Value
(63.2)
Prior Value compares a measured value with the previously measured value. Confidence intervals were not taken into account in determining the direction of the comparison.
Prevention Agenda 2013-2018
(75.1)
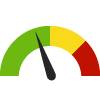
County: Albany Circulatory Composite PQI Rate
County: Albany Circulatory Composite PQI Rate
29.7
Rate per 10,000 population
(2014-2016)
Compared to:
NY Counties Exclusive of NYC
The distribution is based on data from 57 New York counties and does not include counties in New York City.
Capital Region Value
(29.0)
The regional value is compared to the Capital Region value. The comparison value is provided by the Healthy Capital District Initiative.
Prior Value
(28.5)
Prior Value compares a measured value with the previously measured value. Confidence intervals were not taken into account in determining the direction of the comparison.
County: Albany Diabetes Composite PQI Rate
County: Albany Diabetes Composite PQI Rate
16.3
Rate per 10,000 population
(2014-2016)
Compared to:
NY Counties Exclusive of NYC
The distribution is based on data from 57 New York counties and does not include counties in New York City.
Capital Region Value
(13.8)
The regional value is compared to the Capital Region value. The comparison value is provided by the Healthy Capital District Initiative.
Prior Value
(15.1)
Prior Value compares a measured value with the previously measured value. Confidence intervals were not taken into account in determining the direction of the comparison.
County: Albany Diabetes Hospitalization Rate (18+ years)
County: Albany Diabetes Hospitalization Rate (18+ years)
16.3
Rate per 10,000 population
(2014-2016)
Compared to:
NY Counties Exclusive of NYC
The distribution is based on data from 57 New York counties and does not include counties in New York City.
Capital Region Value
(13.7)
The regional value is compared to the Capital Region value. The comparison value is provided by the Healthy Capital District Initiative.
Prior Value
(14.4)
Prior Value compares a measured value with the previously measured value. Confidence intervals were not taken into account in determining the direction of the comparison.
County: Albany Mental Diseases and Disorders Hospitalizations (18+)
County: Albany Mental Diseases and Disorders Hospitalizations (18+)
72.4
Rate per 10,000 population
(2014-2016)
Compared to:
NY Counties Exclusive of NYC
The distribution is based on data from 57 New York counties and does not include counties in New York City.
Capital Region Value
(81.8)
The regional value is compared to the Capital Region value. The comparison value is provided by the Healthy Capital District Initiative.
Prior Value
(50.2)
Prior Value compares a measured value with the previously measured value. Confidence intervals were not taken into account in determining the direction of the comparison.
County: Albany Opioid Overdose Emergency Department Rate
County: Albany Opioid Overdose Emergency Department Rate
25.8
Rate per 100,000 population
(2014-2016)
Compared to:

NY Counties Exclusive of NYC
The distribution is based on data from 57 New York counties and does not include counties in New York City.
Capital Region Value
(36.0)
The regional value is compared to the Capital Region value. The comparison value is provided by the Healthy Capital District Initiative.
Prior Value
(18.9)
Prior Value compares a measured value with the previously measured value. Confidence intervals were not taken into account in determining the direction of the comparison.
County: Albany Percentage of adults who are obese
County: Albany Percentage of adults who are obese
25.7%
Percent of adults
(2013-2014)
Compared to:
NY Counties Exclusive of NYC
The distribution is based on data from 57 New York counties and does not include counties in New York City.
Capital Region Value
(27.6%)
The regional value is compared to the Capital Region value. The comparison value is provided by the Healthy Capital District Initiative.
Prevention Agenda 2013-2018
(23.2%)
65.1%
(2014)
Compared to:
NY Counties
Capital Region Value
(70.0%)
The regional value is compared to the Capital Region value. The comparison value is provided by the Healthy Capital District Initiative.
Prevention Agenda 2013-2018
(80.0%)
County: Albany Percentage of cigarette smoking among adults
County: Albany Percentage of cigarette smoking among adults
16.3%
Percent of adults
(2013-2014)
Compared to:
NY Counties Exclusive of NYC
The distribution is based on data from 57 New York counties and does not include counties in New York City.
Capital Region Value
(19.1%)
The regional value is compared to the Capital Region value. The comparison value is provided by the Healthy Capital District Initiative.
Prevention Agenda 2013-2018
(12.3%)
County: Albany Premature deaths (death before age 65)
County: Albany Premature deaths (death before age 65)
22.4%
Percentage
(2016)
Compared to:
NY Counties Exclusive of NYC
The distribution is based on data from 57 New York counties and does not include counties in New York City.
Capital Region Value
(22.8%)
The regional value is compared to the Capital Region value. The comparison value is provided by the Healthy Capital District Initiative.
Prior Value
(23.0%)
Prior Value compares a measured value with the previously measured value. Confidence intervals were not taken into account in determining the direction of the comparison.
Prevention Agenda 2013-2018
(21.8%)
County: Albany Respiratory Composite PQI Rate
County: Albany Respiratory Composite PQI Rate
25.3
Rate per 10,000 population
(2014-2016)
Compared to:
NY Counties Exclusive of NYC
The distribution is based on data from 57 New York counties and does not include counties in New York City.
Capital Region Value
(25.5)
The regional value is compared to the Capital Region value. The comparison value is provided by the Healthy Capital District Initiative.
Prior Value
(27.4)
Prior Value compares a measured value with the previously measured value. Confidence intervals were not taken into account in determining the direction of the comparison.
County: Albany
Health / Alcohol & Drug Use
Value
Compared to:
County: Albany Age-Adjusted Death Rate due to Heroin Overdose
County: Albany Age-Adjusted Death Rate due to Heroin Overdose
5.8
Deaths per 100,000 population
(2020)
Compared to:

NY Counties Exclusive of NYC
The distribution is based on data from 57 New York counties and does not include counties in New York City.
NY Counties
The distribution is based on data from 57 New York counties.
NY State Value Exclusive of NYC
(6.3)
The regional value is compared to the New York State value (excluding New York City).
Prior Value
(7.8)
Prior Value compares a measured value with the previously measured value. Confidence intervals were not taken into account in determining the direction of the comparison.
Trend
This comparison measures the indicator’s values over multiple time periods.<br>The Mann-Kendall Test for Statistical Significance is used to evaluate the trend<br>over 4 to 10 periods of measure, subject to data availability and comparability.
HP 2030 Target
(4.2)
County: Albany Age-Adjusted Death Rate due to Opioid Pain Relievers
County: Albany Age-Adjusted Death Rate due to Opioid Pain Relievers
23.0
Deaths per 100,000 population
(2020)
Compared to:

NY Counties Exclusive of NYC
The distribution is based on data from 57 New York counties and does not include counties in New York City.
NY Counties
The distribution is based on data from 57 New York counties.
NY State Value Exclusive of NYC
(20.7)
The regional value is compared to the New York State value (excluding New York City).
Prior Value
(16.3)
Prior Value compares a measured value with the previously measured value. Confidence intervals were not taken into account in determining the direction of the comparison.
Trend
This comparison measures the indicator’s values over multiple time periods.<br>The Mann-Kendall Test for Statistical Significance is used to evaluate the trend<br>over 4 to 10 periods of measure, subject to data availability and comparability.
County: Albany Age-Adjusted Drug and Opioid-Involved Overdose Death Rate
County: Albany Age-Adjusted Drug and Opioid-Involved Overdose Death Rate
22.0
Deaths per 100,000 population
(2018-2020)
Compared to:
NY Counties
The distribution is based on data from 54 New York counties.
U.S. Counties
The distribution is based on data from 1,303 U.S. counties and county equivalents.
NY Value
(20.6)
The regional value is compared to the New York State value.
US Value
(23.5)
The regional value is compared to the national value.
Prior Value
(18.1)
Prior Value compares a measured value with the previously measured value. Confidence intervals were taken into account in determining the direction of the comparison.
46.3
Visits per 100,000 population
(2020)
Compared to:
NY Counties
The distribution is based on data from 53 New York counties.
NY Counties Exclusive of NYC
The distribution is based on data from 53 New York counties and does not include counties in New York City.
NY State Value Exclusive of NYC
(32.1)
The regional value is compared to the New York State value (excluding New York City).
Prior Value
(43.1)
Prior Value compares a measured value with the previously measured value. Confidence intervals were not taken into account in determining the direction of the comparison.
Trend
This comparison measures the indicator’s values over multiple time periods.<br>The Mann-Kendall Test for Statistical Significance is used to evaluate the trend<br>over 4 to 10 periods of measure, subject to data availability and comparability.
75.3
Visits per 100,000 population
(2020)
Compared to:
NY Counties Exclusive of NYC
The distribution is based on data from 56 New York counties and does not include counties in New York City.
NY Counties
The distribution is based on data from 56 New York counties.
NY State Value Exclusive of NYC
(60.9)
The regional value is compared to the New York State value (excluding New York City).
Prior Value
(59.9)
Prior Value compares a measured value with the previously measured value. Confidence intervals were not taken into account in determining the direction of the comparison.
Trend
This comparison measures the indicator’s values over multiple time periods.<br>The Mann-Kendall Test for Statistical Significance is used to evaluate the trend<br>over 4 to 10 periods of measure, subject to data availability and comparability.
County: Albany Age-Adjusted Hospital Discharge Rate due to Heroin Overdose
County: Albany Age-Adjusted Hospital Discharge Rate due to Heroin Overdose
8.8
Discharges per 100,000 population
(2020)
Compared to:
NY Counties
The distribution is based on data from 39 New York counties.
NY Counties Exclusive of NYC
The distribution is based on data from 39 New York counties and does not include counties in New York City.
NY State Value Exclusive of NYC
(9.3)
The regional value is compared to the New York State value (excluding New York City).
Prior Value
(6.9)
Prior Value compares a measured value with the previously measured value. Confidence intervals were not taken into account in determining the direction of the comparison.
Trend
This comparison measures the indicator’s values over multiple time periods.<br>The Mann-Kendall Test for Statistical Significance is used to evaluate the trend<br>over 4 to 10 periods of measure, subject to data availability and comparability.
County: Albany Age-Adjusted Hospital Discharge Rate due to Opioid Overdose
County: Albany Age-Adjusted Hospital Discharge Rate due to Opioid Overdose
6.0
Discharges per 100,000 population
(2020)
Compared to:
NY Counties Exclusive of NYC
(2017)
The distribution is based on data from 45 New York counties and does not include counties in New York City.
NY Counties
(2017)
The distribution is based on data from 45 New York counties.
NY State Value Exclusive of NYC
(5.6)
The regional value is compared to the New York State value (excluding New York City).
Prior Value
(7.2)
Prior Value compares a measured value with the previously measured value. Confidence intervals were not taken into account in determining the direction of the comparison.
Trend
This comparison measures the indicator’s values over multiple time periods.<br>The Mann-Kendall Test for Statistical Significance is used to evaluate the trend<br>over 4 to 10 periods of measure, subject to data availability and comparability.
County: Albany Age-Adjusted Rate of Adults who Binge Drink
County: Albany Age-Adjusted Rate of Adults who Binge Drink
15.8%
(2021)
Compared to:
NY Counties Exclusive of NYC
The distribution is based on data from 56 New York counties and does not include counties in New York City.
NY Value
(16.0%)
The regional value is compared to the New York State value.
US Value
(15.4%)
The regional value is compared to the national value. The source for the national value is Behavioral Risk Factor Surveillance System
Capital Region Value
(18.1% in 2016)
The regional value is compared to the Capital Region value. The comparison value is provided by the Healthy Capital District Initiative.
Prior Value
(19.2%)
Prior Value compares a measured value with the previously measured value. Confidence intervals were taken into account in determining the direction of the comparison.
Prevention Agenda 2019-2024
(16.4%)
<div>The New York State Prevention Agenda 2019-2024 objective is to reduce the age-adjusted percentage of adults who binge drink to 16.4%.</div>
Trend
This comparison measures the indicator’s values over multiple time periods.<br>The Mann-Kendall Test for Statistical Significance is used to evaluate the trend<br>over 4 to 10 periods of measure, subject to data availability and comparability.
County: Albany Death Rate due to Drug Poisoning
County: Albany Death Rate due to Drug Poisoning
25.8
Deaths per 100,000 population
(2019-2021)
Compared to:
NY Counties
The distribution is based on data from 61 New York counties.
U.S. Counties
The distribution is based on data from 1,899 U.S. counties and county equivalents.
NY Value
(24.6)
The regional value is compared to the New York State value.
US Value
(27.2)
The regional value is compared to the national value.
HP 2030 Target
(20.7)
<div>SU-03: Reduce drug overdose deaths <strong>(LEADING HEALTH INDICATOR)</strong></div>
County: Albany
Health / Cancer
Value
Compared to:
County: Albany Adults with Cancer
County: Albany Adults with Cancer
7.0%
(2021)
Compared to:
NY Counties
The distribution is based on data from 62 New York counties.
U.S. Counties
The distribution is based on data from 3,074 U.S. counties and county equivalents.
US Value
(7.0%)
The regional value is compared to the national value.
County: Albany Age-Adjusted Death Rate due to Breast Cancer
County: Albany Age-Adjusted Death Rate due to Breast Cancer
20.2
Deaths per 100,000 females
(2016-2020)
Compared to:

NY Counties
The distribution is based on data from 59 New York counties.
U.S. Counties
The distribution is based on data from 1,755 U.S. counties and county equivalents.
NY Value
(18.6)
The regional value is compared to the New York State value.
US Value
(19.6)
The regional value is compared to the national value.
Prior Value
(20.4)
Prior Value compares a measured value with the previously measured value. Confidence intervals were taken into account in determining the direction of the comparison.
Trend
This comparison measures the indicator’s values over multiple time periods.<br>The Mann-Kendall Test for Statistical Significance is used to evaluate the trend<br>over 4 to 10 periods of measure, subject to data availability and comparability.
HP 2030 Target
(15.3)
County: Albany Age-Adjusted Death Rate due to Colorectal Cancer
County: Albany Age-Adjusted Death Rate due to Colorectal Cancer
10.5
Deaths per 100,000 population
(2016-2020)
Compared to:
NY Counties
The distribution is based on data from 61 New York counties.
U.S. Counties
The distribution is based on data from 2,174 U.S. counties and county equivalents.
NY Value
(11.9)
The regional value is compared to the New York State value.
US Value
(13.1)
The regional value is compared to the national value.
Prior Value
(11.1)
Prior Value compares a measured value with the previously measured value. Confidence intervals were taken into account in determining the direction of the comparison.
Trend
This comparison measures the indicator’s values over multiple time periods.<br>The Mann-Kendall Test for Statistical Significance is used to evaluate the trend<br>over 4 to 10 periods of measure, subject to data availability and comparability.
HP 2030 Target
(8.9)
County: Albany Age-Adjusted Death Rate due to Lung Cancer
County: Albany Age-Adjusted Death Rate due to Lung Cancer
37.7
Deaths per 100,000 population
(2016-2020)
Compared to:
NY Counties
The distribution is based on data from 62 New York counties.
U.S. Counties
The distribution is based on data from 2,752 U.S. counties and county equivalents.
NY Value
(30.1)
The regional value is compared to the New York State value.
US Value
(35.0)
The regional value is compared to the national value.
Prior Value
(40.8)
Prior Value compares a measured value with the previously measured value. Confidence intervals were taken into account in determining the direction of the comparison.
Trend
This comparison measures the indicator’s values over multiple time periods.<br>The Mann-Kendall Test for Statistical Significance is used to evaluate the trend<br>over 4 to 10 periods of measure, subject to data availability and comparability.
HP 2030 Target
(25.1)
County: Albany Age-Adjusted Death Rate due to Prostate Cancer
County: Albany Age-Adjusted Death Rate due to Prostate Cancer
18.1
Deaths per 100,000 males
(2016-2020)
Compared to:
U.S. Counties
The distribution is based on data from 1,576 U.S. counties and county equivalents.
NY Value
(16.8)
The regional value is compared to the New York State value.
US Value
(18.8)
The regional value is compared to the national value.
Prior Value
(18.3)
Prior Value compares a measured value with the previously measured value. Confidence intervals were taken into account in determining the direction of the comparison.
Trend
This comparison measures the indicator’s values over multiple time periods.<br>The Mann-Kendall Test for Statistical Significance is used to evaluate the trend<br>over 4 to 10 periods of measure, subject to data availability and comparability.
HP 2030 Target
(16.9)
County: Albany Breast Cancer Incidence Rate
County: Albany Breast Cancer Incidence Rate
146.0
Cases per 100,000 females
(2016-2020)
Compared to:
NY Counties
The distribution is based on data from 62 New York counties.
U.S. Counties
The distribution is based on data from 2,478 U.S. counties and county equivalents.
NY Value
(134.0)
The regional value is compared to the New York State value.
US Value
(127.0)
The regional value is compared to the national value.
Prior Value
(155.8)
Prior Value compares a measured value with the previously measured value. Confidence intervals were taken into account in determining the direction of the comparison.
Trend
This comparison measures the indicator’s values over multiple time periods.<br>The Mann-Kendall Test for Statistical Significance is used to evaluate the trend<br>over 4 to 10 periods of measure, subject to data availability and comparability.
County: Albany Cancer: Medicare Population
County: Albany Cancer: Medicare Population
12.0%
(2022)
Compared to:
NY Counties
The distribution is based on data from 62 New York counties.
U.S. Counties
The distribution is based on data from 3,129 U.S. counties and county equivalents.
NY Value
(13.0%)
The regional value is compared to the New York State value.
US Value
(12.0%)
The regional value is compared to the national value.
Prior Value
(12.0%)
Prior Value compares a measured value with the previously measured value. Confidence intervals were not taken into account in determining the direction of the comparison.
Trend
This comparison measures the indicator’s values over multiple time periods.<br>The Mann-Kendall Test for Statistical Significance is used to evaluate the trend<br>over 4 to 10 periods of measure, subject to data availability and comparability.
County: Albany Cervical Cancer Incidence Rate
County: Albany Cervical Cancer Incidence Rate
6.3
Cases per 100,000 females
(2016-2020)
Compared to:
NY Counties
The distribution is based on data from 32 New York counties.
U.S. Counties
The distribution is based on data from 696 U.S. counties and county equivalents.
NY Value
(7.4)
The regional value is compared to the New York State value.
US Value
(7.5)
The regional value is compared to the national value.
Prior Value
(6.9)
Prior Value compares a measured value with the previously measured value. Confidence intervals were taken into account in determining the direction of the comparison.
Trend
This comparison measures the indicator’s values over multiple time periods.<br>The Mann-Kendall Test for Statistical Significance is used to evaluate the trend<br>over 4 to 10 periods of measure, subject to data availability and comparability.
County: Albany Cervical Cancer Screening: 21-65
County: Albany Cervical Cancer Screening: 21-65
83.8%
(2020)
Compared to:
NY Counties
The distribution is based on data from 62 New York counties.
U.S. Counties
The distribution is based on data from 3,141 U.S. counties and county equivalents.
US Value
(82.8%)
The regional value is compared to the national value.
County: Albany Colon Cancer Screening: USPSTF Recommendation
County: Albany Colon Cancer Screening: USPSTF Recommendation
73.3%
(2018)
Compared to:
NY Counties Exclusive of NYC
(2016)
The distribution is based on data from 57 New York counties and does not include counties in New York City.
NY Value
(68.5% in 2016)
The regional value is compared to the New York State value.
NY State Value Exclusive of NYC
(68.5% in 2016)
The regional value is compared to the New York State value (excluding New York City).
Capital Region Value
(76.3% in 2016)
The regional value is compared to the Capital Region value. The comparison value is provided by the Healthy Capital District Initiative.
Prior Value
(79.0%)
Prior Value compares a measured value with the previously measured value. Confidence intervals were taken into account in determining the direction of the comparison.
County: Albany Colorectal Cancer Incidence Rate
County: Albany Colorectal Cancer Incidence Rate
37.0
Cases per 100,000 population
(2016-2020)
Compared to:
NY Counties
The distribution is based on data from 62 New York counties.
U.S. Counties
The distribution is based on data from 2,401 U.S. counties and county equivalents.
NY Value
(36.6)
The regional value is compared to the New York State value.
US Value
(36.5)
The regional value is compared to the national value.
Prior Value
(36.9)
Prior Value compares a measured value with the previously measured value. Confidence intervals were taken into account in determining the direction of the comparison.
Trend
This comparison measures the indicator’s values over multiple time periods.<br>The Mann-Kendall Test for Statistical Significance is used to evaluate the trend<br>over 4 to 10 periods of measure, subject to data availability and comparability.
County: Albany Lung and Bronchus Cancer Incidence Rate
County: Albany Lung and Bronchus Cancer Incidence Rate
69.4
Cases per 100,000 population
(2016-2020)
Compared to:
NY Counties
The distribution is based on data from 62 New York counties.
U.S. Counties
The distribution is based on data from 2,471 U.S. counties and county equivalents.
NY Value
(55.4)
The regional value is compared to the New York State value.
US Value
(54.0)
The regional value is compared to the national value.
Prior Value
(71.8)
Prior Value compares a measured value with the previously measured value. Confidence intervals were taken into account in determining the direction of the comparison.
Trend
This comparison measures the indicator’s values over multiple time periods.<br>The Mann-Kendall Test for Statistical Significance is used to evaluate the trend<br>over 4 to 10 periods of measure, subject to data availability and comparability.
County: Albany Mammogram in Past 2 Years: 50-74
County: Albany Mammogram in Past 2 Years: 50-74
75.2%
(2021)
Compared to:
NY Counties Exclusive of NYC
The distribution is based on data from 57 New York counties and does not include counties in New York City.
NY Value
(78.2%)
The regional value is compared to the New York State value.
US Value
(76.3% in 2022)
The regional value is compared to the national value. The source for the national value is Behavioral Risk Factor Surveillance System
Capital Region Value
(80.2%)
The regional value is compared to the Capital Region value. The comparison value is provided by the Healthy Capital District Initiative.
Prior Value
(84.7%)
Prior Value compares a measured value with the previously measured value. Confidence intervals were taken into account in determining the direction of the comparison.
Trend
This comparison measures the indicator’s values over multiple time periods.<br>The Mann-Kendall Test for Statistical Significance is used to evaluate the trend<br>over 4 to 10 periods of measure, subject to data availability and comparability.
HP 2030 Target
(80.3%)
County: Albany Mammography Screening: Medicare Population
County: Albany Mammography Screening: Medicare Population
51.0%
(2022)
Compared to:
NY Counties
The distribution is based on data from 62 New York counties.
U.S. Counties
The distribution is based on data from 3,123 U.S. counties and county equivalents.
NY Value
(46.0%)
The regional value is compared to the New York State value.
US Value
(47.0%)
The regional value is compared to the national value.
Prior Value
(48.0%)
Prior Value compares a measured value with the previously measured value. Confidence intervals were not taken into account in determining the direction of the comparison.
Trend
This comparison measures the indicator’s values over multiple time periods.<br>The Mann-Kendall Test for Statistical Significance is used to evaluate the trend<br>over 4 to 10 periods of measure, subject to data availability and comparability.
County: Albany Oral Cavity and Pharynx Cancer Incidence Rate
County: Albany Oral Cavity and Pharynx Cancer Incidence Rate
14.8
Cases per 100,000 population
(2016-2020)
Compared to:
NY Counties
The distribution is based on data from 61 New York counties.
U.S. Counties
The distribution is based on data from 1,706 U.S. counties and county equivalents.
NY Value
(11.3)
The regional value is compared to the New York State value.
US Value
(11.9)
The regional value is compared to the national value.
Prior Value
(14.0)
Prior Value compares a measured value with the previously measured value. Confidence intervals were taken into account in determining the direction of the comparison.
Trend
This comparison measures the indicator’s values over multiple time periods.<br>The Mann-Kendall Test for Statistical Significance is used to evaluate the trend<br>over 4 to 10 periods of measure, subject to data availability and comparability.
County: Albany Pap Test in Past 3 Years: 21-65
County: Albany Pap Test in Past 3 Years: 21-65
88.8%
(2018)
Compared to:
NY Counties Exclusive of NYC
The distribution is based on data from 57 New York counties and does not include counties in New York City.
NY Value
(84.7%)
The regional value is compared to the New York State value.
US Value
(80.2%)
The regional value is compared to the national value. The source for the national value is Behavioral Risk Factor Surveillance System
Capital Region Value
(83.5% in 2016)
The regional value is compared to the Capital Region value. The comparison value is provided by the Healthy Capital District Initiative.
Prior Value
(82.1%)
Prior Value compares a measured value with the previously measured value. Confidence intervals were taken into account in determining the direction of the comparison.
County: Albany Prostate Cancer Incidence Rate
County: Albany Prostate Cancer Incidence Rate
130.7
Cases per 100,000 males
(2016-2020)
Compared to:
NY Counties
The distribution is based on data from 62 New York counties.
U.S. Counties
The distribution is based on data from 2,500 U.S. counties and county equivalents.
NY Value
(130.3)
The regional value is compared to the New York State value.
US Value
(110.5)
The regional value is compared to the national value.
Prior Value
(129.5)
Prior Value compares a measured value with the previously measured value. Confidence intervals were taken into account in determining the direction of the comparison.
Trend
This comparison measures the indicator’s values over multiple time periods.<br>The Mann-Kendall Test for Statistical Significance is used to evaluate the trend<br>over 4 to 10 periods of measure, subject to data availability and comparability.
County: Albany
Health / County Health Rankings
Value
Compared to:
County: Albany Clinical Care Ranking
County: Albany Clinical Care Ranking
7
(2023)
Compared to:
NY Counties
The distribution is based on data from 62 New York counties.
County: Albany Health Behaviors Ranking
County: Albany Health Behaviors Ranking
13
(2023)
Compared to:
NY Counties
The distribution is based on data from 62 New York counties.
County: Albany Morbidity Ranking
County: Albany Morbidity Ranking
15
(2023)
Compared to:
NY Counties
The distribution is based on data from 62 New York counties.
County: Albany Mortality Ranking
County: Albany Mortality Ranking
24
(2023)
Compared to:
NY Counties
The distribution is based on data from 62 New York counties.
County: Albany Physical Environment Ranking
County: Albany Physical Environment Ranking
46
(2023)
Compared to:
NY Counties
The distribution is based on data from 62 New York counties.
County: Albany Social and Economic Factors Ranking
County: Albany Social and Economic Factors Ranking
6
(2023)
Compared to:
NY Counties
The distribution is based on data from 62 New York counties.
County: Albany
Health / Diabetes
Value
Compared to:
County: Albany Age-Adjusted Death Rate due to Diabetes
County: Albany Age-Adjusted Death Rate due to Diabetes
19.2
Deaths per 100,000 population
(2018-2020)
Compared to:
NY Counties
The distribution is based on data from 61 New York counties.
U.S. Counties
The distribution is based on data from 1,937 U.S. counties and county equivalents.
NY Value
(19.1)
The regional value is compared to the New York State value.
US Value
(22.6)
The regional value is compared to the national value.
Prior Value
(17.5)
Prior Value compares a measured value with the previously measured value. Confidence intervals were taken into account in determining the direction of the comparison.
Trend
This comparison measures the indicator’s values over multiple time periods.<br>The Mann-Kendall Test for Statistical Significance is used to evaluate the trend<br>over 4 to 10 periods of measure, subject to data availability and comparability.
County: Albany Age-Adjusted Rate of Adults with Diabetes
County: Albany Age-Adjusted Rate of Adults with Diabetes
8.7%
(2021)
Compared to:
NY Counties Exclusive of NYC
The distribution is based on data from 56 New York counties and does not include counties in New York City.
NY Value
(10.2%)
The regional value is compared to the New York State value.
US Value
(10.9%)
The regional value is compared to the national value. The source for the national value is Behavioral Risk Factor Surveillance System
Capital Region Value
(7.6% in 2016)
The regional value is compared to the Capital Region value. The comparison value is provided by the Healthy Capital District Initiative.
Prior Value
(7.7%)
Prior Value compares a measured value with the previously measured value. Confidence intervals were taken into account in determining the direction of the comparison.
Trend
This comparison measures the indicator’s values over multiple time periods.<br>The Mann-Kendall Test for Statistical Significance is used to evaluate the trend<br>over 4 to 10 periods of measure, subject to data availability and comparability.
County: Albany Diabetes: Medicare Population
County: Albany Diabetes: Medicare Population
24.0%
(2022)
Compared to:
NY Counties
The distribution is based on data from 62 New York counties.
U.S. Counties
The distribution is based on data from 3,129 U.S. counties and county equivalents.
NY Value
(28.0%)
The regional value is compared to the New York State value.
US Value
(24.0%)
The regional value is compared to the national value.
Prior Value
(24.0%)
Prior Value compares a measured value with the previously measured value. Confidence intervals were not taken into account in determining the direction of the comparison.
Trend
This comparison measures the indicator’s values over multiple time periods.<br>The Mann-Kendall Test for Statistical Significance is used to evaluate the trend<br>over 4 to 10 periods of measure, subject to data availability and comparability.
County: Albany Diabetic Monitoring: Medicare Population
County: Albany Diabetic Monitoring: Medicare Population
89.4%
(2019)
Compared to:
NY Counties
The distribution is based on data from 62 New York counties.
U.S. Counties
The distribution is based on data from 3,097 U.S. counties and county equivalents.
NY Value
(88.6%)
The regional value is compared to the New York State value.
US Value
(87.5%)
The regional value is compared to the national value.
Prior Value
(87.6%)
Prior Value compares a measured value with the previously measured value. Confidence intervals were taken into account in determining the direction of the comparison.
Trend
This comparison measures the indicator’s values over multiple time periods.<br>The Mann-Kendall Test for Statistical Significance is used to evaluate the trend<br>over 4 to 10 periods of measure, subject to data availability and comparability.
County: Albany
Health / Disabilities
Value
Compared to:
County: Albany Adults with Disability Living in Poverty
County: Albany Adults with Disability Living in Poverty
30.9%
(2018-2022)
Compared to:
NY Counties
The distribution is based on data from 62 New York counties.
U.S. Counties
The distribution is based on data from 3,132 U.S. counties and county equivalents.
NY Value
(29.0%)
The regional value is compared to the New York State value.
US Value
(24.9%)
The regional value is compared to the national value.
Trend
This comparison measures the indicator’s values over multiple time periods.<br>The Mann-Kendall Test for Statistical Significance is used to evaluate the trend<br>over 4 to 10 periods of measure, subject to data availability and comparability.
County: Albany Children with a Disability
County: Albany Children with a Disability
3.9%
(2018-2022)
Compared to:


NY Value
(4.1%)
The regional value is compared to the New York State value.
US Value
(4.5%)
The regional value is compared to the national value.
Trend
This comparison measures the indicator’s values over multiple time periods.<br>The Mann-Kendall Test for Statistical Significance is used to evaluate the trend<br>over 4 to 10 periods of measure, subject to data availability and comparability.
County: Albany Persons with a Cognitive Difficulty
County: Albany Persons with a Cognitive Difficulty
5.1%
(2018-2022)
Compared to:


NY Value
(4.9%)
The regional value is compared to the New York State value.
US Value
(5.3%)
The regional value is compared to the national value.
Trend
This comparison measures the indicator’s values over multiple time periods.<br>The Mann-Kendall Test for Statistical Significance is used to evaluate the trend<br>over 4 to 10 periods of measure, subject to data availability and comparability.
County: Albany Persons with a Disability
County: Albany Persons with a Disability
11.8%
(2018-2022)
Compared to:
NY Value
(11.9%)
The regional value is compared to the New York State value.
US Value
(12.9%)
The regional value is compared to the national value.
Trend
This comparison measures the indicator’s values over multiple time periods.<br>The Mann-Kendall Test for Statistical Significance is used to evaluate the trend<br>over 4 to 10 periods of measure, subject to data availability and comparability.
County: Albany Persons with a Hearing Difficulty
County: Albany Persons with a Hearing Difficulty
2.7%
(2018-2022)
Compared to:
NY Value
(2.8%)
The regional value is compared to the New York State value.
US Value
(3.6%)
The regional value is compared to the national value.
Trend
This comparison measures the indicator’s values over multiple time periods.<br>The Mann-Kendall Test for Statistical Significance is used to evaluate the trend<br>over 4 to 10 periods of measure, subject to data availability and comparability.
County: Albany Persons with a Self-Care Difficulty
County: Albany Persons with a Self-Care Difficulty
1.7%
(2018-2022)
Compared to:

NY Value
(2.8%)
The regional value is compared to the New York State value.
US Value
(2.6%)
The regional value is compared to the national value.
Trend
This comparison measures the indicator’s values over multiple time periods.<br>The Mann-Kendall Test for Statistical Significance is used to evaluate the trend<br>over 4 to 10 periods of measure, subject to data availability and comparability.
County: Albany Persons with a Vision Difficulty
County: Albany Persons with a Vision Difficulty
1.8%
(2018-2022)
Compared to:
NY Value
(2.1%)
The regional value is compared to the New York State value.
US Value
(2.4%)
The regional value is compared to the national value.
Trend
This comparison measures the indicator’s values over multiple time periods.<br>The Mann-Kendall Test for Statistical Significance is used to evaluate the trend<br>over 4 to 10 periods of measure, subject to data availability and comparability.
County: Albany Persons with an Ambulatory Difficulty
County: Albany Persons with an Ambulatory Difficulty
5.3%
(2018-2022)
Compared to:
NY Value
(6.6%)
The regional value is compared to the New York State value.
US Value
(6.7%)
The regional value is compared to the national value.
Trend
This comparison measures the indicator’s values over multiple time periods.<br>The Mann-Kendall Test for Statistical Significance is used to evaluate the trend<br>over 4 to 10 periods of measure, subject to data availability and comparability.
County: Albany
Health / Family Planning
Value
Compared to:
County: Albany Teen Birth Rate: 15-17
County: Albany Teen Birth Rate: 15-17
6.0
Live births per 1,000 females aged 15-17
(2014-2016)
Compared to:
NY Counties
The distribution is based on data from 62 New York counties.
NY Value
(6.6)
The regional value is compared to the New York State value.
Prior Value
(6.9)
Prior Value compares a measured value with the previously measured value. Confidence intervals were not taken into account in determining the direction of the comparison.
Trend
This comparison measures the indicator’s values over multiple time periods.<br>The Mann-Kendall Test for Statistical Significance is used to evaluate the trend<br>over 4 to 10 periods of measure, subject to data availability and comparability.
County: Albany Teen Birth Rate: 15-19
County: Albany Teen Birth Rate: 15-19
3.3
Live births per 1,000 females aged 15-19
(2017-2019)
Compared to:
NY Counties
The distribution is based on data from 61 New York counties.
NY Value
(3.1)
The regional value is compared to the New York State value.
US Value
(17.6)
The regional value is compared to the national value. The source for the national value is Centers for Disease Control and Prevention, National Center for Health Statistics
Prior Value
(10.1)
Prior Value compares a measured value with the previously measured value. Confidence intervals were not taken into account in determining the direction of the comparison.
Trend
This comparison measures the indicator’s values over multiple time periods.<br>The Mann-Kendall Test for Statistical Significance is used to evaluate the trend<br>over 4 to 10 periods of measure, subject to data availability and comparability.
County: Albany Teen Pregnancy Rate
County: Albany Teen Pregnancy Rate
18.2
Pregnancies per 1,000 females aged 15-17
(2012-2014)
Compared to:
NY Counties
The distribution is based on data from 62 New York counties.
NY Value
(19.6)
The regional value is compared to the New York State value.
Capital Region Value
(22.4 in 2011-2013)
The regional value is compared to the Capital Region value. The comparison value is provided by the Healthy Capital District Initiative.
Prior Value
(18.3)
Prior Value compares a measured value with the previously measured value. Confidence intervals were not taken into account in determining the direction of the comparison.
Trend
This comparison measures the indicator’s values over multiple time periods.<br>The Mann-Kendall Test for Statistical Significance is used to evaluate the trend<br>over 4 to 10 periods of measure, subject to data availability and comparability.
County: Albany
Health / Health Care Access & Quality
Value
Compared to:
County: Albany Adults who have had a Routine Checkup
County: Albany Adults who have had a Routine Checkup
75.3%
(2016)
Compared to:
NY Counties Exclusive of NYC
The distribution is based on data from 57 New York counties and does not include counties in New York City.
NY Value
(71.6%)
The regional value is compared to the New York State value.
Capital Region Value
(72.5%)
The regional value is compared to the Capital Region value. The comparison value is provided by the Healthy Capital District Initiative.
Prior Value
(72.3%)
Prior Value compares a measured value with the previously measured value. Confidence intervals were taken into account in determining the direction of the comparison.
County: Albany Adults who have had a Routine Checkup
County: Albany Adults who have had a Routine Checkup
77.7%
(2021)
Compared to:
NY Counties
The distribution is based on data from 62 New York counties.
U.S. Counties
The distribution is based on data from 3,074 U.S. counties and county equivalents.
US Value
(73.6%)
The regional value is compared to the national value.
County: Albany Adults with Health Insurance
County: Albany Adults with Health Insurance
95.0%
(2022)
Compared to:

NY Counties
The distribution is based on data from 38 New York counties.
U.S. Counties
The distribution is based on data from 828 U.S. counties and county equivalents.
NY Value
(93.2%)
The regional value is compared to the New York State value.
US Value
(88.7%)
The regional value is compared to the national value.
Prior Value
(95.7%)
Prior Value compares a measured value with the previously measured value. Confidence intervals were taken into account in determining the direction of the comparison.
Trend
This comparison measures the indicator’s values over multiple time periods.<br>The Mann-Kendall Test for Statistical Significance is used to evaluate the trend<br>over 4 to 10 periods of measure, subject to data availability and comparability.
County: Albany Adults without Health Insurance
County: Albany Adults without Health Insurance
5.3%
(2021)
Compared to:
NY Counties
The distribution is based on data from 62 New York counties.
U.S. Counties
The distribution is based on data from 3,074 U.S. counties and county equivalents.
US Value
(10.8%)
The regional value is compared to the national value.
County: Albany Age-Adjusted Rate of Adults Unable to Afford to See a Doctor
County: Albany Age-Adjusted Rate of Adults Unable to Afford to See a Doctor
6.2%
(2021)
Compared to:
NY Counties Exclusive of NYC
The distribution is based on data from 54 New York counties and does not include counties in New York City.
NY Value
(8.4%)
The regional value is compared to the New York State value.
US Value
(8.7%)
The regional value is compared to the national value. The source for the national value is Behavioral Risk Factor Surveillance System
Capital Region Value
(8.8% in 2016)
The regional value is compared to the Capital Region value. The comparison value is provided by the Healthy Capital District Initiative.
Prior Value
(9.2%)
Prior Value compares a measured value with the previously measured value. Confidence intervals were taken into account in determining the direction of the comparison.
Trend
This comparison measures the indicator’s values over multiple time periods.<br>The Mann-Kendall Test for Statistical Significance is used to evaluate the trend<br>over 4 to 10 periods of measure, subject to data availability and comparability.
85.1%
(2021)
Compared to:
NY Counties Exclusive of NYC
(2018)
The distribution is based on data from 57 New York counties and does not include counties in New York City.
NY Value
(85.0%)
The regional value is compared to the New York State value.
US Value
(84.2%)
The regional value is compared to the national value. The source for the national value is Behavioral Risk Factor Surveillance System
Capital Region Value
(85.8% in 2016)
The regional value is compared to the Capital Region value. The comparison value is provided by the Healthy Capital District Initiative.
Prior Value
(84.6%)
Prior Value compares a measured value with the previously measured value. Confidence intervals were taken into account in determining the direction of the comparison.
Prevention Agenda 2019-2024
(86.7%)
<div>The New York State Prevention Agenda 2019-2024 objective is to increase the age-adjusted percentage of adults with a usual primary care provider to 86.7%.</div>
Trend
This comparison measures the indicator’s values over multiple time periods.<br>The Mann-Kendall Test for Statistical Significance is used to evaluate the trend<br>over 4 to 10 periods of measure, subject to data availability and comparability.
County: Albany Children with Health Insurance
County: Albany Children with Health Insurance
98.0%
(2022)
Compared to:
NY Counties
The distribution is based on data from 38 New York counties.
U.S. Counties
The distribution is based on data from 828 U.S. counties and county equivalents.
NY Value
(97.4%)
The regional value is compared to the New York State value.
US Value
(94.9%)
The regional value is compared to the national value.
Prior Value
(98.0%)
Prior Value compares a measured value with the previously measured value. Confidence intervals were taken into account in determining the direction of the comparison.
Trend
This comparison measures the indicator’s values over multiple time periods.<br>The Mann-Kendall Test for Statistical Significance is used to evaluate the trend<br>over 4 to 10 periods of measure, subject to data availability and comparability.
County: Albany Medicare Healthcare Costs
County: Albany Medicare Healthcare Costs
$8,885
Dollars per enrollee
(2015)
Compared to:

NY Value
($9,686)
The regional value is compared to the New York State value.
US Value
($9,729)
The regional value is compared to the national value.
Prior Value
($8,271)
Prior Value compares a measured value with the previously measured value. Confidence intervals were not taken into account in determining the direction of the comparison.
Trend
This comparison measures the indicator’s values over multiple time periods.<br>The Mann-Kendall Test for Statistical Significance is used to evaluate the trend<br>over 4 to 10 periods of measure, subject to data availability and comparability.
County: Albany Non-Physician Primary Care Provider Rate
County: Albany Non-Physician Primary Care Provider Rate
267
Providers per 100,000 population
(2023)
Compared to:
NY Counties
The distribution is based on data from 62 New York counties.
U.S. Counties
The distribution is based on data from 3,129 U.S. counties and county equivalents.
NY Value
(154)
The regional value is compared to the New York State value.
Prior Value
(245)
Prior Value compares a measured value with the previously measured value. Confidence intervals were not taken into account in determining the direction of the comparison.
Trend
This comparison measures the indicator’s values over multiple time periods.<br>The Mann-Kendall Test for Statistical Significance is used to evaluate the trend<br>over 4 to 10 periods of measure, subject to data availability and comparability.
County: Albany Persons with Health Insurance
County: Albany Persons with Health Insurance
95.3%
(2021)
Compared to:
NY Counties
The distribution is based on data from 62 New York counties.
U.S. Counties
The distribution is based on data from 3,140 U.S. counties and county equivalents.
NY Value
(93.9%)
The regional value is compared to the New York State value.
Prior Value
(95.3%)
Prior Value compares a measured value with the previously measured value. Confidence intervals were taken into account in determining the direction of the comparison.
Trend
This comparison measures the indicator’s values over multiple time periods.<br>The Mann-Kendall Test for Statistical Significance is used to evaluate the trend<br>over 4 to 10 periods of measure, subject to data availability and comparability.
HP 2030 Target
(92.4%)
<div>AHS-01: Increase the proportion of people with health insurance <strong>(LEADING HEALTH INDICATOR)</strong></div>
County: Albany Persons with Private Health Insurance Only
County: Albany Persons with Private Health Insurance Only
60.8%
(2022)
Compared to:
NY Value
(52.2%)
The regional value is compared to the New York State value.
US Value
(54.8%)
The regional value is compared to the national value.
Prior Value
(56.9%)
Prior Value compares a measured value with the previously measured value. Confidence intervals were not taken into account in determining the direction of the comparison.
Trend
This comparison measures the indicator’s values over multiple time periods.<br>The Mann-Kendall Test for Statistical Significance is used to evaluate the trend<br>over 4 to 10 periods of measure, subject to data availability and comparability.
County: Albany Persons with Public Health Insurance Only
County: Albany Persons with Public Health Insurance Only
19.0%
(2022)
Compared to:

NY Value
(29.7%)
The regional value is compared to the New York State value.
US Value
(24.8%)
The regional value is compared to the national value.
Prior Value
(23.6%)
Prior Value compares a measured value with the previously measured value. Confidence intervals were not taken into account in determining the direction of the comparison.
Trend
This comparison measures the indicator’s values over multiple time periods.<br>The Mann-Kendall Test for Statistical Significance is used to evaluate the trend<br>over 4 to 10 periods of measure, subject to data availability and comparability.
County: Albany Preventable Hospital Stays: Medicare Population
County: Albany Preventable Hospital Stays: Medicare Population
2,395.0
Discharges per 100,000 Medicare enrollees
(2022)
Compared to:
NY Counties
The distribution is based on data from 62 New York counties.
U.S. Counties
The distribution is based on data from 3,129 U.S. counties and county equivalents.
NY Value
(2,617.0)
The regional value is compared to the New York State value.
US Value
(2,677.0)
The regional value is compared to the national value.
Prior Value
(2,491.0)
Prior Value compares a measured value with the previously measured value. Confidence intervals were not taken into account in determining the direction of the comparison.
Trend
This comparison measures the indicator’s values over multiple time periods.<br>The Mann-Kendall Test for Statistical Significance is used to evaluate the trend<br>over 4 to 10 periods of measure, subject to data availability and comparability.
County: Albany Primary Care Provider Rate
County: Albany Primary Care Provider Rate
96
Providers per 100,000 population
(2021)
Compared to:
NY Counties
The distribution is based on data from 62 New York counties.
U.S. Counties
The distribution is based on data from 2,984 U.S. counties and county equivalents.
NY Value
(80)
The regional value is compared to the New York State value.
Prior Value
(101)
Prior Value compares a measured value with the previously measured value. Confidence intervals were not taken into account in determining the direction of the comparison.
Trend
This comparison measures the indicator’s values over multiple time periods.<br>The Mann-Kendall Test for Statistical Significance is used to evaluate the trend<br>over 4 to 10 periods of measure, subject to data availability and comparability.
County: Albany
Health / Health Information Technology
Value
Compared to:
County: Albany Households with an Internet Subscription
County: Albany Households with an Internet Subscription
88.3%
(2018-2022)
Compared to:
NY Counties
The distribution is based on data from 62 New York counties.
U.S. Counties
The distribution is based on data from 3,133 U.S. counties and county equivalents.
NY Value
(88.4%)
The regional value is compared to the New York State value.
US Value
(88.5%)
The regional value is compared to the national value.
Trend
This comparison measures the indicator’s values over multiple time periods.<br>The Mann-Kendall Test for Statistical Significance is used to evaluate the trend<br>over 4 to 10 periods of measure, subject to data availability and comparability.
County: Albany Households with One or More Types of Computing Devices
County: Albany Households with One or More Types of Computing Devices
93.7%
(2018-2022)
Compared to:
NY Counties
The distribution is based on data from 62 New York counties.
U.S. Counties
The distribution is based on data from 3,133 U.S. counties and county equivalents.
NY Value
(93.1%)
The regional value is compared to the New York State value.
US Value
(94.0%)
The regional value is compared to the national value.
Trend
This comparison measures the indicator’s values over multiple time periods.<br>The Mann-Kendall Test for Statistical Significance is used to evaluate the trend<br>over 4 to 10 periods of measure, subject to data availability and comparability.
County: Albany Persons with an Internet Subscription
County: Albany Persons with an Internet Subscription
91.3%
(2018-2022)
Compared to:
NY Counties
The distribution is based on data from 62 New York counties.
U.S. Counties
The distribution is based on data from 3,133 U.S. counties and county equivalents.
NY Value
(90.6%)
The regional value is compared to the New York State value.
US Value
(91.0%)
The regional value is compared to the national value.
Trend
This comparison measures the indicator’s values over multiple time periods.<br>The Mann-Kendall Test for Statistical Significance is used to evaluate the trend<br>over 4 to 10 periods of measure, subject to data availability and comparability.
County: Albany
Health / Heart Disease & Stroke
Value
Compared to:
County: Albany Adults who Experienced a Stroke
County: Albany Adults who Experienced a Stroke
2.7%
(2021)
Compared to:
NY Counties
The distribution is based on data from 62 New York counties.
U.S. Counties
The distribution is based on data from 3,074 U.S. counties and county equivalents.
US Value
(3.3%)
The regional value is compared to the national value.
County: Albany Adults who Experienced Coronary Heart Disease
County: Albany Adults who Experienced Coronary Heart Disease
5.8%
(2021)
Compared to:
NY Counties
The distribution is based on data from 62 New York counties.
U.S. Counties
The distribution is based on data from 3,074 U.S. counties and county equivalents.
US Value
(6.1%)
The regional value is compared to the national value.
County: Albany Adults who Have Taken Medications for High Blood Pressure
County: Albany Adults who Have Taken Medications for High Blood Pressure
77.3%
(2021)
Compared to:
NY Counties
The distribution is based on data from 62 New York counties.
U.S. Counties
The distribution is based on data from 3,074 U.S. counties and county equivalents.
US Value
(78.2%)
The regional value is compared to the national value.
Prevention Agenda 2019-2024
(80.7%)
<div><span>This target aims to increase the percentage of adults with hypertension who are currently taking medicine to manage their high blood pressure. </span></div>
County: Albany Age-Adjusted Cholesterol Test History
County: Albany Age-Adjusted Cholesterol Test History
90.1%
(2021)
Compared to:
NY Counties Exclusive of NYC
(2014)
The distribution is based on data from 57 New York counties and does not include counties in New York City.
NY Value
(90.7%)
The regional value is compared to the New York State value.
Prior Value
(86.6%)
Prior Value compares a measured value with the previously measured value. Confidence intervals were taken into account in determining the direction of the comparison.
25.2
Deaths per 100,000 population
(2018-2020)
Compared to:
NY Counties
The distribution is based on data from 61 New York counties.
U.S. Counties
The distribution is based on data from 2,338 U.S. counties and county equivalents.
NY Value
(24.3)
The regional value is compared to the New York State value.
US Value
(37.6)
The regional value is compared to the national value.
Prior Value
(25.3)
Prior Value compares a measured value with the previously measured value. Confidence intervals were taken into account in determining the direction of the comparison.
Trend
This comparison measures the indicator’s values over multiple time periods.<br>The Mann-Kendall Test for Statistical Significance is used to evaluate the trend<br>over 4 to 10 periods of measure, subject to data availability and comparability.
HP 2030 Target
(33.4)
County: Albany Age-Adjusted Death Rate due to Coronary Heart Disease
County: Albany Age-Adjusted Death Rate due to Coronary Heart Disease
94.2
Deaths per 100,000 population
(2018-2020)
Compared to:
NY Counties
The distribution is based on data from 62 New York counties.
U.S. Counties
The distribution is based on data from 2,852 U.S. counties and county equivalents.
NY Value
(118.7)
The regional value is compared to the New York State value.
US Value
(90.2)
The regional value is compared to the national value.
Prior Value
(91.1)
Prior Value compares a measured value with the previously measured value. Confidence intervals were taken into account in determining the direction of the comparison.
Trend
This comparison measures the indicator’s values over multiple time periods.<br>The Mann-Kendall Test for Statistical Significance is used to evaluate the trend<br>over 4 to 10 periods of measure, subject to data availability and comparability.
HP 2030 Target
(71.1)
County: Albany Age-Adjusted Death Rate due to Heart Attack
County: Albany Age-Adjusted Death Rate due to Heart Attack
44.1
Deaths per 100,000 population 35+ years
(2020)
Compared to:
NY Counties
The distribution is based on data from 60 New York counties.
NY Value
(43.4)
The regional value is compared to the New York State value.
Prior Value
(39.7)
Prior Value compares a measured value with the previously measured value. Confidence intervals were not taken into account in determining the direction of the comparison.
Trend
This comparison measures the indicator’s values over multiple time periods.<br>The Mann-Kendall Test for Statistical Significance is used to evaluate the trend<br>over 4 to 10 periods of measure, subject to data availability and comparability.
County: Albany Age-Adjusted Hospitalization Rate due to Heart Attack
County: Albany Age-Adjusted Hospitalization Rate due to Heart Attack
16.3
Hospitalizations per 10,000 population 35+ years
(2021)
Compared to:
NY Counties
The distribution is based on data from 62 New York counties.
NY Value
(19.7 in 2020)
The regional value is compared to the New York State value.
Prior Value
(21.0)
Prior Value compares a measured value with the previously measured value. Confidence intervals were not taken into account in determining the direction of the comparison.
Trend
This comparison measures the indicator’s values over multiple time periods.<br>The Mann-Kendall Test for Statistical Significance is used to evaluate the trend<br>over 4 to 10 periods of measure, subject to data availability and comparability.
County: Albany Age-Adjusted Rate of High Blood Pressure Prevalence
County: Albany Age-Adjusted Rate of High Blood Pressure Prevalence
28.5%
(2021)
Compared to:
NY Counties Exclusive of NYC
The distribution is based on data from 56 New York counties and does not include counties in New York City.
NY Value
(27.6%)
The regional value is compared to the New York State value.
US Value
(32.4%)
The regional value is compared to the national value. The source for the national value is Behavioral Risk Factor Surveillance System
Capital Region Value
(30.9% in 2016)
The regional value is compared to the Capital Region value. The comparison value is provided by the Healthy Capital District Initiative.
Prior Value
(33.8%)
Prior Value compares a measured value with the previously measured value. Confidence intervals were taken into account in determining the direction of the comparison.
HP 2030 Target
(41.9%)
County: Albany Age-Adjusted Rate of High Cholesterol Prevalence
County: Albany Age-Adjusted Rate of High Cholesterol Prevalence
31.5%
(2014)
Compared to:
NY Counties Exclusive of NYC
The distribution is based on data from 57 New York counties and does not include counties in New York City.
NY Value
(34.5%)
The regional value is compared to the New York State value.
US Value
(35.7% in 2021)
The regional value is compared to the national value. The source for the national value is Behavioral Risk Factor Surveillance System
County: Albany Atrial Fibrillation: Medicare Population
County: Albany Atrial Fibrillation: Medicare Population
15.0%
(2022)
Compared to:
NY Counties
The distribution is based on data from 62 New York counties.
U.S. Counties
The distribution is based on data from 3,129 U.S. counties and county equivalents.
NY Value
(14.0%)
The regional value is compared to the New York State value.
US Value
(14.0%)
The regional value is compared to the national value.
Prior Value
(15.0%)
Prior Value compares a measured value with the previously measured value. Confidence intervals were not taken into account in determining the direction of the comparison.
Trend
This comparison measures the indicator’s values over multiple time periods.<br>The Mann-Kendall Test for Statistical Significance is used to evaluate the trend<br>over 4 to 10 periods of measure, subject to data availability and comparability.
County: Albany Cholesterol Test History
County: Albany Cholesterol Test History
85.8%
(2021)
Compared to:
NY Counties
The distribution is based on data from 62 New York counties.
U.S. Counties
The distribution is based on data from 3,074 U.S. counties and county equivalents.
US Value
(86.4%)
The regional value is compared to the national value.
County: Albany Heart Failure: Medicare Population
County: Albany Heart Failure: Medicare Population
12.0%
(2022)
Compared to:
NY Counties
The distribution is based on data from 62 New York counties.
U.S. Counties
The distribution is based on data from 3,129 U.S. counties and county equivalents.
NY Value
(11.0%)
The regional value is compared to the New York State value.
US Value
(11.0%)
The regional value is compared to the national value.
Prior Value
(12.0%)
Prior Value compares a measured value with the previously measured value. Confidence intervals were not taken into account in determining the direction of the comparison.
Trend
This comparison measures the indicator’s values over multiple time periods.<br>The Mann-Kendall Test for Statistical Significance is used to evaluate the trend<br>over 4 to 10 periods of measure, subject to data availability and comparability.
County: Albany High Cholesterol Prevalence: Past 5 Years
County: Albany High Cholesterol Prevalence: Past 5 Years
33.9%
(2021)
Compared to:
NY Counties
The distribution is based on data from 62 New York counties.
U.S. Counties
The distribution is based on data from 3,074 U.S. counties and county equivalents.
US Value
(36.4%)
The regional value is compared to the national value.
County: Albany Hyperlipidemia: Medicare Population
County: Albany Hyperlipidemia: Medicare Population
66.0%
(2022)
Compared to:
NY Counties
The distribution is based on data from 62 New York counties.
U.S. Counties
The distribution is based on data from 3,129 U.S. counties and county equivalents.
NY Value
(67.0%)
The regional value is compared to the New York State value.
US Value
(65.0%)
The regional value is compared to the national value.
Prior Value
(65.0%)
Prior Value compares a measured value with the previously measured value. Confidence intervals were not taken into account in determining the direction of the comparison.
Trend
This comparison measures the indicator’s values over multiple time periods.<br>The Mann-Kendall Test for Statistical Significance is used to evaluate the trend<br>over 4 to 10 periods of measure, subject to data availability and comparability.
County: Albany Hypertension: Medicare Population
County: Albany Hypertension: Medicare Population
65.0%
(2022)
Compared to:
NY Counties
The distribution is based on data from 62 New York counties.
U.S. Counties
The distribution is based on data from 3,129 U.S. counties and county equivalents.
NY Value
(65.0%)
The regional value is compared to the New York State value.
US Value
(65.0%)
The regional value is compared to the national value.
Prior Value
(65.0%)
Prior Value compares a measured value with the previously measured value. Confidence intervals were not taken into account in determining the direction of the comparison.
Trend
This comparison measures the indicator’s values over multiple time periods.<br>The Mann-Kendall Test for Statistical Significance is used to evaluate the trend<br>over 4 to 10 periods of measure, subject to data availability and comparability.
County: Albany Ischemic Heart Disease: Medicare Population
County: Albany Ischemic Heart Disease: Medicare Population
27.0%
(2022)
Compared to:
NY Counties
The distribution is based on data from 62 New York counties.
U.S. Counties
The distribution is based on data from 3,129 U.S. counties and county equivalents.
NY Value
(24.0%)
The regional value is compared to the New York State value.
US Value
(21.0%)
The regional value is compared to the national value.
Prior Value
(25.0%)
Prior Value compares a measured value with the previously measured value. Confidence intervals were not taken into account in determining the direction of the comparison.
Trend
This comparison measures the indicator’s values over multiple time periods.<br>The Mann-Kendall Test for Statistical Significance is used to evaluate the trend<br>over 4 to 10 periods of measure, subject to data availability and comparability.
County: Albany Stroke: Medicare Population
County: Albany Stroke: Medicare Population
6.0%
(2022)
Compared to:
NY Counties
The distribution is based on data from 62 New York counties.
U.S. Counties
The distribution is based on data from 3,129 U.S. counties and county equivalents.
NY Value
(7.0%)
The regional value is compared to the New York State value.
US Value
(6.0%)
The regional value is compared to the national value.
Prior Value
(7.0%)
Prior Value compares a measured value with the previously measured value. Confidence intervals were not taken into account in determining the direction of the comparison.
Trend
This comparison measures the indicator’s values over multiple time periods.<br>The Mann-Kendall Test for Statistical Significance is used to evaluate the trend<br>over 4 to 10 periods of measure, subject to data availability and comparability.
County: Albany
Health / Immunizations & Infectious Diseases
Value
Compared to:
County: Albany Adults 65+ with Influenza Vaccination
County: Albany Adults 65+ with Influenza Vaccination
67.1%
(2021)
Compared to:
NY Counties Exclusive of NYC
(2016)
The distribution is based on data from 57 New York counties and does not include counties in New York City.
NY Value
(66.8%)
The regional value is compared to the New York State value.
US Value
(68.6%)
The regional value is compared to the national value. The source for the national value is Behavioral Risk Factor Surveillance System
Capital Region Value
(59.6% in 2016)
The regional value is compared to the Capital Region value. The comparison value is provided by the Healthy Capital District Initiative.
Prior Value
(50.3%)
Prior Value compares a measured value with the previously measured value. Confidence intervals were taken into account in determining the direction of the comparison.
Trend
This comparison measures the indicator’s values over multiple time periods.<br>The Mann-Kendall Test for Statistical Significance is used to evaluate the trend<br>over 4 to 10 periods of measure, subject to data availability and comparability.
Prevention Agenda 2013-2018
(70.0%)
<div>The New York State Prevention Agenda 2013-2018 objective is to increase the percentage of adults aged 65 years and older who received an influenza vaccination in the past year to 70.0%.</div>
County: Albany Adults 65+ with Pneumonia Vaccination
County: Albany Adults 65+ with Pneumonia Vaccination
75.5%
(2021)
Compared to:
NY Counties Exclusive of NYC
(2018)
The distribution is based on data from 57 New York counties and does not include counties in New York City.
NY Value
(65.6%)
The regional value is compared to the New York State value.
US Value
(71.0%)
The regional value is compared to the national value. The source for the national value is Behavioral Risk Factor Surveillance System
Capital Region Value
(74.7% in 2016)
The regional value is compared to the Capital Region value. The comparison value is provided by the Healthy Capital District Initiative.
Prior Value
(70.2%)
Prior Value compares a measured value with the previously measured value. Confidence intervals were taken into account in determining the direction of the comparison.
Trend
This comparison measures the indicator’s values over multiple time periods.<br>The Mann-Kendall Test for Statistical Significance is used to evaluate the trend<br>over 4 to 10 periods of measure, subject to data availability and comparability.
County: Albany Age-Adjusted Death Rate due to Influenza and Pneumonia
County: Albany Age-Adjusted Death Rate due to Influenza and Pneumonia
17.6
Deaths per 100,000 population
(2018-2020)
Compared to:
NY Counties
The distribution is based on data from 58 New York counties.
U.S. Counties
The distribution is based on data from 1,449 U.S. counties and county equivalents.
NY Value
(17.7)
The regional value is compared to the New York State value.
US Value
(13.4)
The regional value is compared to the national value.
Prior Value
(19.2)
Prior Value compares a measured value with the previously measured value. Confidence intervals were taken into account in determining the direction of the comparison.
Trend
This comparison measures the indicator’s values over multiple time periods.<br>The Mann-Kendall Test for Statistical Significance is used to evaluate the trend<br>over 4 to 10 periods of measure, subject to data availability and comparability.
County: Albany COVID-19 Daily Average Case-Fatality Rate
County: Albany COVID-19 Daily Average Case-Fatality Rate
2.7
Deaths per 100 cases
(Mar 3, 2023)
Compared to:
NY Counties
(Feb 24, 2023)
The distribution is based on data from 61 New York counties.
U.S. Counties
(Mar 25, 2022)
The distribution is based on data from 2,811 U.S. counties and county equivalents.
NY Value
(1.0)
The regional value is compared to the New York State value.
US Value
(1.7)
The regional value is compared to the national value.
Prior Value
(0.0)
Prior Value compares a measured value with the previously measured value. Confidence intervals were not taken into account in determining the direction of the comparison.
Trend
This comparison measures the indicator’s values over multiple time periods.<br>The Mann-Kendall Test for Statistical Significance is used to evaluate the trend<br>over 4 to 10 periods of measure, subject to data availability and comparability.
County: Albany COVID-19 Daily Average Incidence Rate
County: Albany COVID-19 Daily Average Incidence Rate
8.55
Cases per 100,000 population
(Mar 3, 2023)
Compared to:
NY Counties
The distribution is based on data from 62 New York counties.
U.S. Counties
The distribution is based on data from 3,142 U.S. counties and county equivalents.
NY Value
(9.93)
The regional value is compared to the New York State value.
US Value
(10.97)
The regional value is compared to the national value.
Prior Value
(10.37)
Prior Value compares a measured value with the previously measured value. Confidence intervals were not taken into account in determining the direction of the comparison.
Trend
This comparison measures the indicator’s values over multiple time periods.<br>The Mann-Kendall Test for Statistical Significance is used to evaluate the trend<br>over 4 to 10 periods of measure, subject to data availability and comparability.
County: Albany Flu Vaccinations: Medicare Population
County: Albany Flu Vaccinations: Medicare Population
59.0%
(2022)
Compared to:
NY Counties
The distribution is based on data from 62 New York counties.
U.S. Counties
The distribution is based on data from 3,129 U.S. counties and county equivalents.
NY Value
(52.0%)
The regional value is compared to the New York State value.
US Value
(50.0%)
The regional value is compared to the national value.
Prior Value
(57.0%)
Prior Value compares a measured value with the previously measured value. Confidence intervals were not taken into account in determining the direction of the comparison.
Trend
This comparison measures the indicator’s values over multiple time periods.<br>The Mann-Kendall Test for Statistical Significance is used to evaluate the trend<br>over 4 to 10 periods of measure, subject to data availability and comparability.
County: Albany Lyme Disease Incidence Rate
County: Albany Lyme Disease Incidence Rate
134.5
Cases per 100,000 population
(2017-2019)
Compared to:
NY Counties
The distribution is based on data from 61 New York counties.
NY Value
(44.7)
The regional value is compared to the New York State value.
Prior Value
(71.5)
Prior Value compares a measured value with the previously measured value. Confidence intervals were not taken into account in determining the direction of the comparison.
Trend
This comparison measures the indicator’s values over multiple time periods.<br>The Mann-Kendall Test for Statistical Significance is used to evaluate the trend<br>over 4 to 10 periods of measure, subject to data availability and comparability.
County: Albany Persons Fully Vaccinated Against COVID-19
County: Albany Persons Fully Vaccinated Against COVID-19
77.9%
(May 10, 2023)
Compared to:
NY Counties
The distribution is based on data from 62 New York counties.
U.S. Counties
The distribution is based on data from 3,125 U.S. counties and county equivalents.
Prior Value
(77.9%)
Prior Value compares a measured value with the previously measured value. Confidence intervals were not taken into account in determining the direction of the comparison.
Trend
This comparison measures the indicator’s values over multiple time periods.<br>The Mann-Kendall Test for Statistical Significance is used to evaluate the trend<br>over 4 to 10 periods of measure, subject to data availability and comparability.
County: Albany Pneumonia Vaccinations: Medicare Population
County: Albany Pneumonia Vaccinations: Medicare Population
8.0%
(2022)
Compared to:

NY Counties
The distribution is based on data from 62 New York counties.
U.S. Counties
The distribution is based on data from 3,129 U.S. counties and county equivalents.
NY Value
(7.0%)
The regional value is compared to the New York State value.
US Value
(8.0%)
The regional value is compared to the national value.
Prior Value
(5.0%)
Prior Value compares a measured value with the previously measured value. Confidence intervals were not taken into account in determining the direction of the comparison.
Trend
This comparison measures the indicator’s values over multiple time periods.<br>The Mann-Kendall Test for Statistical Significance is used to evaluate the trend<br>over 4 to 10 periods of measure, subject to data availability and comparability.
County: Albany
Health / Maternal, Fetal & Infant Health
Value
Compared to:
County: Albany Babies with Low Birthweight
County: Albany Babies with Low Birthweight
8.2%
(2018-2020)
Compared to:
NY Counties
The distribution is based on data from 61 New York counties.
NY Value
(8.1%)
The regional value is compared to the New York State value.
US Value
(8.3%)
The regional value is compared to the national value. The source for the national value is Centers for Disease Control and Prevention
Prior Value
(8.2%)
Prior Value compares a measured value with the previously measured value. Confidence intervals were not taken into account in determining the direction of the comparison.
Trend
This comparison measures the indicator’s values over multiple time periods.<br>The Mann-Kendall Test for Statistical Significance is used to evaluate the trend<br>over 4 to 10 periods of measure, subject to data availability and comparability.
County: Albany Infant Mortality Rate
County: Albany Infant Mortality Rate
2.0
Deaths per 1,000 live births
(2018-2020)
Compared to:
NY Counties
(2017-2019)
The distribution is based on data from 61 New York counties.
NY Value
(1.5)
The regional value is compared to the New York State value.
US Value
(5.6)
The regional value is compared to the national value. The source for the national value is Centers for Disease Control and Prevention
Prior Value
(5.5)
Prior Value compares a measured value with the previously measured value. Confidence intervals were not taken into account in determining the direction of the comparison.
Trend
This comparison measures the indicator’s values over multiple time periods.<br>The Mann-Kendall Test for Statistical Significance is used to evaluate the trend<br>over 4 to 10 periods of measure, subject to data availability and comparability.
HP 2030 Target
(5.0)
<div>MICH-02: Reduce the rate of infant deaths <strong>(LEADING HEALTH INDICATOR)</strong></div>
County: Albany Mothers who Received Late or No Prenatal Care
County: Albany Mothers who Received Late or No Prenatal Care
5.4%
(2018-2020)
Compared to:
NY Counties
(2017-2019)
The distribution is based on data from 61 New York counties.
NY Value
(5.3%)
The regional value is compared to the New York State value.
US Value
(6.0% in 2020)
The regional value is compared to the national value. The source for the national value is Centers for Disease Control and Prevention
Capital Region Value
(4.4% in 2012-2014)
The regional value is compared to the Capital Region value. The comparison value is provided by the Healthy Capital District Initiative.
Prior Value
(5.6%)
Prior Value compares a measured value with the previously measured value. Confidence intervals were not taken into account in determining the direction of the comparison.
Trend
This comparison measures the indicator’s values over multiple time periods.<br>The Mann-Kendall Test for Statistical Significance is used to evaluate the trend<br>over 4 to 10 periods of measure, subject to data availability and comparability.
County: Albany Preterm Births
County: Albany Preterm Births
1.5%
(2018-2020)
Compared to:
NY Counties
The distribution is based on data from 61 New York counties.
NY Value
(1.5%)
The regional value is compared to the New York State value.
Capital Region Value
(10.4% in 2014)
The regional value is compared to the Capital Region value. The comparison value is provided by the Healthy Capital District Initiative.
Prior Value
(1.5%)
Prior Value compares a measured value with the previously measured value. Confidence intervals were not taken into account in determining the direction of the comparison.
Trend
This comparison measures the indicator’s values over multiple time periods.<br>The Mann-Kendall Test for Statistical Significance is used to evaluate the trend<br>over 4 to 10 periods of measure, subject to data availability and comparability.
Prevention Agenda 2019-2024
(8.3%)
<div>The New York State Prevention Agenda 2019-2024 objective is to reduce the proportion of infants who are born preterm to 8.3%.</div>
HP 2030 Target
(9.4%)
County: Albany
Health / Mental Health & Mental Disorders
Value
Compared to:
County: Albany Adults Ever Diagnosed with Depression
County: Albany Adults Ever Diagnosed with Depression
23.3%
(2021)
Compared to:
NY Counties
The distribution is based on data from 62 New York counties.
U.S. Counties
The distribution is based on data from 3,074 U.S. counties and county equivalents.
US Value
(19.5%)
The regional value is compared to the national value.
County: Albany Age-Adjusted Death Rate due to Suicide
County: Albany Age-Adjusted Death Rate due to Suicide
9.7
Deaths per 100,000 population
(2018-2020)
Compared to:
NY Counties
The distribution is based on data from 48 New York counties.
U.S. Counties
The distribution is based on data from 1,307 U.S. counties and county equivalents.
NY Value
(8.2)
The regional value is compared to the New York State value.
US Value
(13.9)
The regional value is compared to the national value.
Prior Value
(10.5)
Prior Value compares a measured value with the previously measured value. Confidence intervals were taken into account in determining the direction of the comparison.
Trend
This comparison measures the indicator’s values over multiple time periods.<br>The Mann-Kendall Test for Statistical Significance is used to evaluate the trend<br>over 4 to 10 periods of measure, subject to data availability and comparability.
Prevention Agenda 2019-2024
(7)
<div>The New York State Prevention Agenda 2019-2024 objective is to reduce the age-adjusted suicide rate to 7 deaths per 100,000 population.</div>
HP 2030 Target
(12.8)
<div>MHMD-01: Reduce the suicide rate <strong>(LEADING HEALTH INDICATOR)</strong></div>
County: Albany Age-Adjusted Rate of Poor Mental Health: 14+ Days
County: Albany Age-Adjusted Rate of Poor Mental Health: 14+ Days
15.6%
(2021)
Compared to:
NY Counties Exclusive of NYC
The distribution is based on data from 56 New York counties and does not include counties in New York City.
NY Value
(13.4%)
The regional value is compared to the New York State value.
Capital Region Value
(11.5% in 2016)
The regional value is compared to the Capital Region value. The comparison value is provided by the Healthy Capital District Initiative.
Prior Value
(10.1%)
Prior Value compares a measured value with the previously measured value. Confidence intervals were taken into account in determining the direction of the comparison.
Trend
This comparison measures the indicator’s values over multiple time periods.<br>The Mann-Kendall Test for Statistical Significance is used to evaluate the trend<br>over 4 to 10 periods of measure, subject to data availability and comparability.
Prevention Agenda 2013-2018
(10.1%)
<div>The New York State Prevention Agenda 2013-2018 objective is to reduce the age-adjusted percentage of adults with 14 or more poor mental health days in the past month to 10.1%.</div>
County: Albany Depression: Medicare Population
County: Albany Depression: Medicare Population
18.0%
(2022)
Compared to:
NY Counties
The distribution is based on data from 62 New York counties.
U.S. Counties
The distribution is based on data from 3,129 U.S. counties and county equivalents.
NY Value
(16.0%)
The regional value is compared to the New York State value.
US Value
(16.0%)
The regional value is compared to the national value.
Prior Value
(18.0%)
Prior Value compares a measured value with the previously measured value. Confidence intervals were not taken into account in determining the direction of the comparison.
Trend
This comparison measures the indicator’s values over multiple time periods.<br>The Mann-Kendall Test for Statistical Significance is used to evaluate the trend<br>over 4 to 10 periods of measure, subject to data availability and comparability.
County: Albany Frequent Mental Distress
County: Albany Frequent Mental Distress
13.4%
(2019)
Compared to:
NY Counties
The distribution is based on data from 62 New York counties.
U.S. Counties
The distribution is based on data from 3,121 U.S. counties and county equivalents.
NY Value
(12.1%)
The regional value is compared to the New York State value.
US Value
(14.0%)
The regional value is compared to the national value.
Prior Value
(12.4%)
Prior Value compares a measured value with the previously measured value. Confidence intervals were taken into account in determining the direction of the comparison.
County: Albany Mental Health Provider Rate
County: Albany Mental Health Provider Rate
432
Providers per 100,000 population
(2023)
Compared to:
NY Counties
The distribution is based on data from 62 New York counties.
U.S. Counties
The distribution is based on data from 2,956 U.S. counties and county equivalents.
NY Value
(356)
The regional value is compared to the New York State value.
Prior Value
(412)
Prior Value compares a measured value with the previously measured value. Confidence intervals were not taken into account in determining the direction of the comparison.
Trend
This comparison measures the indicator’s values over multiple time periods.<br>The Mann-Kendall Test for Statistical Significance is used to evaluate the trend<br>over 4 to 10 periods of measure, subject to data availability and comparability.
County: Albany
Health / Mortality Data
Value
Compared to:
County: Albany Life Expectancy
County: Albany Life Expectancy
78.7
Years
(2019-2021)
Compared to:
NY Counties
The distribution is based on data from 62 New York counties.
U.S. Counties
The distribution is based on data from 3,070 U.S. counties and county equivalents.
NY Value
(79.7)
The regional value is compared to the New York State value.
US Value
(77.6)
The regional value is compared to the national value.
County: Albany
Health / Nutrition & Healthy Eating
Value
Compared to:
County: Albany Adult Fruit and Vegetable Consumption
County: Albany Adult Fruit and Vegetable Consumption
23.9%
(2009)
Compared to:
NY Counties Exclusive of NYC
The distribution is based on data from 57 New York counties and does not include counties in New York City.
NY Value
(27.1%)
The regional value is compared to the New York State value.
US Value
(23.4%)
The regional value is compared to the national value. The source for the national value is Behavioral Risk Factor Surveillance System
Prevention Agenda 2019-2024
(70.4%)
<div><span>This target aims to increase the percentage of adults, among all adults, who consume less than one fruit and less than one vegetable per day </span></div>
County: Albany
Health / Older Adults
Value
Compared to:
47.4%
(2020)
Compared to:
NY Counties
The distribution is based on data from 62 New York counties.
U.S. Counties
The distribution is based on data from 3,141 U.S. counties and county equivalents.
US Value
(37.9%)
The regional value is compared to the national value.
44.8%
(2020)
Compared to:
NY Counties
The distribution is based on data from 62 New York counties.
U.S. Counties
The distribution is based on data from 3,141 U.S. counties and county equivalents.
US Value
(43.7%)
The regional value is compared to the national value.
County: Albany Adults 65+ with a Disability
County: Albany Adults 65+ with a Disability
29.2%
(2018-2022)
Compared to:
NY Value
(31.6%)
The regional value is compared to the New York State value.
US Value
(33.3%)
The regional value is compared to the national value.
Trend
This comparison measures the indicator’s values over multiple time periods.<br>The Mann-Kendall Test for Statistical Significance is used to evaluate the trend<br>over 4 to 10 periods of measure, subject to data availability and comparability.
County: Albany Adults 65+ with a Hearing Difficulty
County: Albany Adults 65+ with a Hearing Difficulty
10.8%
(2018-2022)
Compared to:
NY Value
(10.9%)
The regional value is compared to the New York State value.
US Value
(13.7%)
The regional value is compared to the national value.
Trend
This comparison measures the indicator’s values over multiple time periods.<br>The Mann-Kendall Test for Statistical Significance is used to evaluate the trend<br>over 4 to 10 periods of measure, subject to data availability and comparability.
County: Albany Adults 65+ with a Self-Care Difficulty
County: Albany Adults 65+ with a Self-Care Difficulty
4.2%
(2018-2022)
Compared to:
NY Value
(8.3%)
The regional value is compared to the New York State value.
US Value
(7.4%)
The regional value is compared to the national value.
Trend
This comparison measures the indicator’s values over multiple time periods.<br>The Mann-Kendall Test for Statistical Significance is used to evaluate the trend<br>over 4 to 10 periods of measure, subject to data availability and comparability.
County: Albany Adults 65+ with a Vision Difficulty
County: Albany Adults 65+ with a Vision Difficulty
3.9%
(2018-2022)
Compared to:
NY Value
(5.5%)
The regional value is compared to the New York State value.
US Value
(6.0%)
The regional value is compared to the national value.
Trend
This comparison measures the indicator’s values over multiple time periods.<br>The Mann-Kendall Test for Statistical Significance is used to evaluate the trend<br>over 4 to 10 periods of measure, subject to data availability and comparability.
County: Albany Adults 65+ with an Independent Living Difficulty
County: Albany Adults 65+ with an Independent Living Difficulty
11.1%
(2018-2022)
Compared to:
NY Value
(15.0%)
The regional value is compared to the New York State value.
US Value
(13.6%)
The regional value is compared to the national value.
Trend
This comparison measures the indicator’s values over multiple time periods.<br>The Mann-Kendall Test for Statistical Significance is used to evaluate the trend<br>over 4 to 10 periods of measure, subject to data availability and comparability.
County: Albany Alzheimer's Disease or Dementia: Medicare Population
County: Albany Alzheimer's Disease or Dementia: Medicare Population
7.0%
(2022)
Compared to:
NY Counties
The distribution is based on data from 62 New York counties.
U.S. Counties
The distribution is based on data from 3,129 U.S. counties and county equivalents.
NY Value
(7.0%)
The regional value is compared to the New York State value.
US Value
(6.0%)
The regional value is compared to the national value.
Prior Value
(7.0%)
Prior Value compares a measured value with the previously measured value. Confidence intervals were not taken into account in determining the direction of the comparison.
Trend
This comparison measures the indicator’s values over multiple time periods.<br>The Mann-Kendall Test for Statistical Significance is used to evaluate the trend<br>over 4 to 10 periods of measure, subject to data availability and comparability.
County: Albany
Health / Oral Health
Value
Compared to:
County: Albany Adults 65+ with Total Tooth Loss
County: Albany Adults 65+ with Total Tooth Loss
9.1%
(2020)
Compared to:
NY Counties
The distribution is based on data from 62 New York counties.
U.S. Counties
The distribution is based on data from 3,141 U.S. counties and county equivalents.
US Value
(13.4%)
The regional value is compared to the national value.
County: Albany Adults with No Tooth Extractions
County: Albany Adults with No Tooth Extractions
52.6%
(2009)
Compared to:
NY Counties Exclusive of NYC
The distribution is based on data from 57 New York counties and does not include counties in New York City.
NY Value
(50.6%)
The regional value is compared to the New York State value.
US Value
(59.8% in 2020)
The regional value is compared to the national value. The source for the national value is Behavioral Risk Factor Surveillance System
County: Albany Age-Adjusted Rate of Adults who Visited a Dentist
County: Albany Age-Adjusted Rate of Adults who Visited a Dentist
74.0%
(2018)
Compared to:
NY Counties Exclusive of NYC
The distribution is based on data from 57 New York counties and does not include counties in New York City.
NY Value
(69.6%)
The regional value is compared to the New York State value.
US Value
(67.6%)
The regional value is compared to the national value. The source for the national value is Behavioral Risk Factor Surveillance System
Capital Region Value
(70.0% in 2016)
The regional value is compared to the Capital Region value. The comparison value is provided by the Healthy Capital District Initiative.
Prior Value
(69.7%)
Prior Value compares a measured value with the previously measured value. Confidence intervals were taken into account in determining the direction of the comparison.
County: Albany Dentist Rate
County: Albany Dentist Rate
89
Dentists per 100,000 population
(2022)
Compared to:
NY Counties
The distribution is based on data from 61 New York counties.
U.S. Counties
The distribution is based on data from 3,054 U.S. counties and county equivalents.
NY Value
(83)
The regional value is compared to the New York State value.
Prior Value
(89)
Prior Value compares a measured value with the previously measured value. Confidence intervals were not taken into account in determining the direction of the comparison.
Trend
This comparison measures the indicator’s values over multiple time periods.<br>The Mann-Kendall Test for Statistical Significance is used to evaluate the trend<br>over 4 to 10 periods of measure, subject to data availability and comparability.
County: Albany
Health / Other Conditions
Value
Compared to:
County: Albany Adults with Arthritis
County: Albany Adults with Arthritis
25.2%
(2021)
Compared to:
NY Counties
The distribution is based on data from 62 New York counties.
U.S. Counties
The distribution is based on data from 3,074 U.S. counties and county equivalents.
US Value
(25.2%)
The regional value is compared to the national value.
County: Albany Adults with Kidney Disease
County: Albany Adults with Kidney Disease
2.9%
(2021)
Compared to:
NY Counties
The distribution is based on data from 62 New York counties.
U.S. Counties
The distribution is based on data from 3,074 U.S. counties and county equivalents.
US Value
(3.1%)
The regional value is compared to the national value.
County: Albany Age-Adjusted Death Rate due to Kidney Disease
County: Albany Age-Adjusted Death Rate due to Kidney Disease
14.9
Deaths per 100,000 population
(2018-2020)
Compared to:
NY Counties
The distribution is based on data from 55 New York counties.
U.S. Counties
The distribution is based on data from 1,416 U.S. counties and county equivalents.
NY Value
(9.8)
The regional value is compared to the New York State value.
US Value
(12.8)
The regional value is compared to the national value.
Prior Value
(15.7)
Prior Value compares a measured value with the previously measured value. Confidence intervals were taken into account in determining the direction of the comparison.
Trend
This comparison measures the indicator’s values over multiple time periods.<br>The Mann-Kendall Test for Statistical Significance is used to evaluate the trend<br>over 4 to 10 periods of measure, subject to data availability and comparability.
County: Albany Chronic Kidney Disease: Medicare Population
County: Albany Chronic Kidney Disease: Medicare Population
15.0%
(2022)
Compared to:
NY Counties
The distribution is based on data from 62 New York counties.
U.S. Counties
The distribution is based on data from 3,129 U.S. counties and county equivalents.
NY Value
(15.0%)
The regional value is compared to the New York State value.
US Value
(18.0%)
The regional value is compared to the national value.
Prior Value
(14.0%)
Prior Value compares a measured value with the previously measured value. Confidence intervals were not taken into account in determining the direction of the comparison.
Trend
This comparison measures the indicator’s values over multiple time periods.<br>The Mann-Kendall Test for Statistical Significance is used to evaluate the trend<br>over 4 to 10 periods of measure, subject to data availability and comparability.
County: Albany Osteoporosis: Medicare Population
County: Albany Osteoporosis: Medicare Population
13.0%
(2022)
Compared to:
NY Counties
The distribution is based on data from 62 New York counties.
U.S. Counties
The distribution is based on data from 3,129 U.S. counties and county equivalents.
NY Value
(12.0%)
The regional value is compared to the New York State value.
US Value
(11.0%)
The regional value is compared to the national value.
Prior Value
(12.0%)
Prior Value compares a measured value with the previously measured value. Confidence intervals were not taken into account in determining the direction of the comparison.
Trend
This comparison measures the indicator’s values over multiple time periods.<br>The Mann-Kendall Test for Statistical Significance is used to evaluate the trend<br>over 4 to 10 periods of measure, subject to data availability and comparability.
County: Albany Rheumatoid Arthritis or Osteoarthritis: Medicare Population
County: Albany Rheumatoid Arthritis or Osteoarthritis: Medicare Population
31.0%
(2022)
Compared to:
NY Counties
The distribution is based on data from 62 New York counties.
U.S. Counties
The distribution is based on data from 3,129 U.S. counties and county equivalents.
NY Value
(35.0%)
The regional value is compared to the New York State value.
US Value
(35.0%)
The regional value is compared to the national value.
Prior Value
(30.0%)
Prior Value compares a measured value with the previously measured value. Confidence intervals were not taken into account in determining the direction of the comparison.
Trend
This comparison measures the indicator’s values over multiple time periods.<br>The Mann-Kendall Test for Statistical Significance is used to evaluate the trend<br>over 4 to 10 periods of measure, subject to data availability and comparability.
County: Albany
Health / Physical Activity
Value
Compared to:
County: Albany Age-Adjusted Rate of Adults who are Sedentary
County: Albany Age-Adjusted Rate of Adults who are Sedentary
80.8%
(2021)
Compared to:
NY Counties Exclusive of NYC
The distribution is based on data from 56 New York counties and does not include counties in New York City.
NY Value
(23.6% in 2018)
The regional value is compared to the New York State value.
US Value
(23.7%)
The regional value is compared to the national value. The source for the national value is Behavioral Risk Factor Surveillance System
Capital Region Value
(20.9% in 2016)
The regional value is compared to the Capital Region value. The comparison value is provided by the Healthy Capital District Initiative.
Prior Value
(18.4%)
Prior Value compares a measured value with the previously measured value. Confidence intervals were not taken into account in determining the direction of the comparison.
Prevention Agenda 2019-2024
(22.6%)
<div>This target aims to decrease the percentage of adults age 18 years and older who do not participate in leisure-time physical activity. </div>
Trend
This comparison measures the indicator’s values over multiple time periods.<br>The Mann-Kendall Test for Statistical Significance is used to evaluate the trend<br>over 4 to 10 periods of measure, subject to data availability and comparability.
HP 2030 Target
(21.8%)
County: Albany
Health / Prevention & Safety
Value
Compared to:
County: Albany Age-Adjusted Death Rate due to Firearms
County: Albany Age-Adjusted Death Rate due to Firearms
5.9
Deaths per 100,000 population
(2018-2020)
Compared to:
U.S. Counties
The distribution is based on data from 1,083 U.S. counties and county equivalents.
NY Value
(4.3)
The regional value is compared to the New York State value.
US Value
(12.0)
The regional value is compared to the national value.
Prior Value
(6.1)
Prior Value compares a measured value with the previously measured value. Confidence intervals were taken into account in determining the direction of the comparison.
Trend
This comparison measures the indicator’s values over multiple time periods.<br>The Mann-Kendall Test for Statistical Significance is used to evaluate the trend<br>over 4 to 10 periods of measure, subject to data availability and comparability.
HP 2030 Target
(10.7)
County: Albany Age-Adjusted Death Rate due to Unintentional Injuries
County: Albany Age-Adjusted Death Rate due to Unintentional Injuries
32.4
Deaths per 100,000 population
(2018-2020)
Compared to:
NY Counties
The distribution is based on data from 60 New York counties.
U.S. Counties
The distribution is based on data from 2,454 U.S. counties and county equivalents.
NY Value
(36.7)
The regional value is compared to the New York State value.
US Value
(51.6)
The regional value is compared to the national value.
Prior Value
(25.7)
Prior Value compares a measured value with the previously measured value. Confidence intervals were taken into account in determining the direction of the comparison.
Trend
This comparison measures the indicator’s values over multiple time periods.<br>The Mann-Kendall Test for Statistical Significance is used to evaluate the trend<br>over 4 to 10 periods of measure, subject to data availability and comparability.
HP 2030 Target
(43.2)
County: Albany
Health / Respiratory Diseases
Value
Compared to:
County: Albany Adults with COPD
County: Albany Adults with COPD
6.4%
Percent of adults
(2021)
Compared to:
NY Counties
The distribution is based on data from 62 New York counties.
U.S. Counties
The distribution is based on data from 3,074 U.S. counties and county equivalents.
US Value
(6.4%)
The regional value is compared to the national value.
County: Albany Adults with Current Asthma
County: Albany Adults with Current Asthma
11.2%
(2021)
Compared to:
NY Counties
The distribution is based on data from 62 New York counties.
U.S. Counties
The distribution is based on data from 3,074 U.S. counties and county equivalents.
US Value
(9.7%)
The regional value is compared to the national value.
30.0
Deaths per 100,000 population
(2018-2020)
Compared to:
NY Counties
The distribution is based on data from 61 New York counties.
U.S. Counties
The distribution is based on data from 2,518 U.S. counties and county equivalents.
NY Value
(27.2)
The regional value is compared to the New York State value.
US Value
(38.1)
The regional value is compared to the national value.
Prior Value
(29.2)
Prior Value compares a measured value with the previously measured value. Confidence intervals were taken into account in determining the direction of the comparison.
Trend
This comparison measures the indicator’s values over multiple time periods.<br>The Mann-Kendall Test for Statistical Significance is used to evaluate the trend<br>over 4 to 10 periods of measure, subject to data availability and comparability.
County: Albany Age-Adjusted Rate of Adults with Asthma
County: Albany Age-Adjusted Rate of Adults with Asthma
12.0%
(2021)
Compared to:
NY Counties Exclusive of NYC
(2018)
The distribution is based on data from 57 New York counties and does not include counties in New York City.
NY Value
(10.1%)
The regional value is compared to the New York State value.
US Value
(14.9%)
The regional value is compared to the national value. The source for the national value is Behavioral Risk Factor Surveillance System
Capital Region Value
(12.9% in 2016)
The regional value is compared to the Capital Region value. The comparison value is provided by the Healthy Capital District Initiative.
Prior Value
(11.7%)
Prior Value compares a measured value with the previously measured value. Confidence intervals were taken into account in determining the direction of the comparison.
Trend
This comparison measures the indicator’s values over multiple time periods.<br>The Mann-Kendall Test for Statistical Significance is used to evaluate the trend<br>over 4 to 10 periods of measure, subject to data availability and comparability.
County: Albany Asthma: Medicare Population
County: Albany Asthma: Medicare Population
8.0%
(2022)
Compared to:
NY Counties
The distribution is based on data from 62 New York counties.
U.S. Counties
The distribution is based on data from 3,129 U.S. counties and county equivalents.
NY Value
(8.0%)
The regional value is compared to the New York State value.
US Value
(7.0%)
The regional value is compared to the national value.
Prior Value
(7.0%)
Prior Value compares a measured value with the previously measured value. Confidence intervals were not taken into account in determining the direction of the comparison.
Trend
This comparison measures the indicator’s values over multiple time periods.<br>The Mann-Kendall Test for Statistical Significance is used to evaluate the trend<br>over 4 to 10 periods of measure, subject to data availability and comparability.
County: Albany COPD: Medicare Population
County: Albany COPD: Medicare Population
10.0%
(2022)
Compared to:
NY Counties
The distribution is based on data from 62 New York counties.
U.S. Counties
The distribution is based on data from 3,129 U.S. counties and county equivalents.
NY Value
(12.0%)
The regional value is compared to the New York State value.
US Value
(11.0%)
The regional value is compared to the national value.
Prior Value
(11.0%)
Prior Value compares a measured value with the previously measured value. Confidence intervals were not taken into account in determining the direction of the comparison.
Trend
This comparison measures the indicator’s values over multiple time periods.<br>The Mann-Kendall Test for Statistical Significance is used to evaluate the trend<br>over 4 to 10 periods of measure, subject to data availability and comparability.
County: Albany
Health / Sexually Transmitted Infections
Value
Compared to:
County: Albany Chlamydia Incidence Rate
County: Albany Chlamydia Incidence Rate
1,351.3
Cases per 100,000 population
(2018-2020)
Compared to:
NY Counties
The distribution is based on data from 60 New York counties.
NY Value
(1,458.6 in 2017-2019)
The regional value is compared to the New York State value.
US Value
(523.5)
The regional value is compared to the national value. The source for the national value is National Center for HIV/AIDS, Viral Hepatitis, STD, and TB Prevention
Prior Value
(1,428.1)
Prior Value compares a measured value with the previously measured value. Confidence intervals were not taken into account in determining the direction of the comparison.
Trend
This comparison measures the indicator’s values over multiple time periods.<br>The Mann-Kendall Test for Statistical Significance is used to evaluate the trend<br>over 4 to 10 periods of measure, subject to data availability and comparability.
County: Albany Gonorrhea Incidence Rate
County: Albany Gonorrhea Incidence Rate
508.5
Cases per 100,000 population
(2018-2020)
Compared to:
NY Counties
The distribution is based on data from 59 New York counties.
NY Value
(433.4 in 2017-2019)
The regional value is compared to the New York State value.
US Value
(191.0)
The regional value is compared to the national value. The source for the national value is National Center for HIV/AIDS, Viral Hepatitis, STD, and TB Prevention
Prior Value
(409.4)
Prior Value compares a measured value with the previously measured value. Confidence intervals were not taken into account in determining the direction of the comparison.
Trend
This comparison measures the indicator’s values over multiple time periods.<br>The Mann-Kendall Test for Statistical Significance is used to evaluate the trend<br>over 4 to 10 periods of measure, subject to data availability and comparability.
County: Albany HIV Diagnosis Rate
County: Albany HIV Diagnosis Rate
7.1
Cases per 100,000 population
(2018-2020)
Compared to:
NY Counties
(2014-2016)
The distribution is based on data from 55 New York counties.
NY Value
(13.1 in 2017-2019)
The regional value is compared to the New York State value.
Prior Value
(9.2)
Prior Value compares a measured value with the previously measured value. Confidence intervals were not taken into account in determining the direction of the comparison.
Trend
This comparison measures the indicator’s values over multiple time periods.<br>The Mann-Kendall Test for Statistical Significance is used to evaluate the trend<br>over 4 to 10 periods of measure, subject to data availability and comparability.
Prevention Agenda 2019-2024
(5.2)
<div>The New York State Prevention Agenda 2019-2024 objective is to decrease the HIV diagnosis rate to 5.2 cases per 100,000 population.</div>
County: Albany
Health / Tobacco Use
Value
Compared to:
County: Albany Age-Adjusted Rate of Adults who Smoke
County: Albany Age-Adjusted Rate of Adults who Smoke
12.7%
(2021)
Compared to:
NY Counties Exclusive of NYC
The distribution is based on data from 56 New York counties and does not include counties in New York City.
NY Value
(12.5%)
The regional value is compared to the New York State value.
US Value
(14.4%)
The regional value is compared to the national value. The source for the national value is Behavioral Risk Factor Surveillance System
Capital Region Value
(17.5% in 2016)
The regional value is compared to the Capital Region value. The comparison value is provided by the Healthy Capital District Initiative.
Prior Value
(11.9%)
Prior Value compares a measured value with the previously measured value. Confidence intervals were taken into account in determining the direction of the comparison.
Trend
This comparison measures the indicator’s values over multiple time periods.<br>The Mann-Kendall Test for Statistical Significance is used to evaluate the trend<br>over 4 to 10 periods of measure, subject to data availability and comparability.
Prevention Agenda 2019-2024
(11%)
<div><span>This target aims to decrease the prevalence of cigarette smoking by adults ages 18 years and older (among all adults). </span></div>
HP 2030 Target
(6.1%)
<div>TU-02: Reduce current cigarette smoking in adults <strong>(LEADING HEALTH INDICATOR)</strong></div>
County: Albany
Health / Weight Status
Value
Compared to:
County: Albany Age-Adjusted Rate of Adults who are Obese
County: Albany Age-Adjusted Rate of Adults who are Obese
32.4%
(2021)
Compared to:
NY Counties Exclusive of NYC
The distribution is based on data from 57 New York counties and does not include counties in New York City.
NY Value
(29.2%)
The regional value is compared to the New York State value.
US Value
(33.9%)
The regional value is compared to the national value. The source for the national value is Behavioral Risk Factor Surveillance System
Capital Region Value
(27.1% in 2016)
The regional value is compared to the Capital Region value. The comparison value is provided by the Healthy Capital District Initiative.
Prior Value
(27.4%)
Prior Value compares a measured value with the previously measured value. Confidence intervals were taken into account in determining the direction of the comparison.
Trend
This comparison measures the indicator’s values over multiple time periods.<br>The Mann-Kendall Test for Statistical Significance is used to evaluate the trend<br>over 4 to 10 periods of measure, subject to data availability and comparability.
Prevention Agenda 2019-2024
(24.2%)
<div>The New York State Prevention Agenda 2019-2024 objective is to decrease the percentage of adults who are obese to 24.2%.</div>
County: Albany Age-Adjusted Rate of Adults who are Overweight or Obese
County: Albany Age-Adjusted Rate of Adults who are Overweight or Obese
64.3%
(2021)
Compared to:
NY Counties Exclusive of NYC
(2018)
The distribution is based on data from 57 New York counties and does not include counties in New York City.
NY Value
(63.5%)
The regional value is compared to the New York State value.
US Value
(68.3%)
The regional value is compared to the national value. The source for the national value is Behavioral Risk Factor Surveillance System
Capital Region Value
(63.4% in 2016)
The regional value is compared to the Capital Region value. The comparison value is provided by the Healthy Capital District Initiative.
Prior Value
(61.5%)
Prior Value compares a measured value with the previously measured value. Confidence intervals were taken into account in determining the direction of the comparison.
Trend
This comparison measures the indicator’s values over multiple time periods.<br>The Mann-Kendall Test for Statistical Significance is used to evaluate the trend<br>over 4 to 10 periods of measure, subject to data availability and comparability.
Prevention Agenda 2019-2024
(24.2%)
<div><span>This target aims to decrease the percentage of adults ages 18 years and older with obesity, among all adults. </span></div>
County: Albany Elementary School Students who are Overweight or Obese
County: Albany Elementary School Students who are Overweight or Obese
31.2%
(2017-2019)
Compared to:
NY Counties
(2014-2016)
The distribution is based on data from 57 New York counties.
NY Value
(31.9%)
The regional value is compared to the New York State value.
Capital Region Value
(32.1% in 2012-2014)
The regional value is compared to the Capital Region value. The comparison value is provided by the Healthy Capital District Initiative.
Prior Value
(30.9%)
Prior Value compares a measured value with the previously measured value. Confidence intervals were not taken into account in determining the direction of the comparison.
Prevention Agenda 2019-2024
(16.4%)
<div><span>This target was established to decrease the percentage of children with obesity among public school students in NYS exclusive of New York City. </span></div>
Trend
This comparison measures the indicator’s values over multiple time periods.<br>The Mann-Kendall Test for Statistical Significance is used to evaluate the trend<br>over 4 to 10 periods of measure, subject to data availability and comparability.
